
Compare Aditya Bir. Fas. with Similar Stocks
Dashboard
Weak Long Term Fundamental Strength with an average Return on Capital Employed (ROCE) of 2.09%
- Poor long term growth as Net Sales has grown by an annual rate of 8.50% and Operating profit at 4.55% over the last 5 years
- Low ability to service debt as the company has a high Debt to EBITDA ratio of 8.25 times
Flat results in Dec 25
Risky - Negative Operating Profits
Below par performance in long term as well as near term
Stock DNA
Garments & Apparels
INR 7,889 Cr (Small Cap)
NA (Loss Making)
73
0.00%
0.56
-11.85%
1.22
Total Returns (Price + Dividend) 
Aditya Bir. Fas. for the last several years.
Risk Adjusted Returns v/s
Returns Beta

News

Aditya Birla Fashion & Retail Ltd is Rated Strong Sell
Aditya Birla Fashion & Retail Ltd is rated Strong Sell by MarketsMOJO, with this rating last updated on 04 Nov 2025. However, the analysis and financial metrics discussed here reflect the stock’s current position as of 11 May 2026, providing investors with an up-to-date view of the company’s fundamentals, valuation, financial trends, and technical outlook.
Read full news article
Aditya Birla Fashion & Retail Ltd is Rated Strong Sell
Aditya Birla Fashion & Retail Ltd is rated Strong Sell by MarketsMOJO. This rating was last updated on 04 Nov 2025. However, the analysis and financial metrics discussed below reflect the stock's current position as of 30 April 2026, providing investors with the latest insights into the company’s performance and outlook.
Read full news article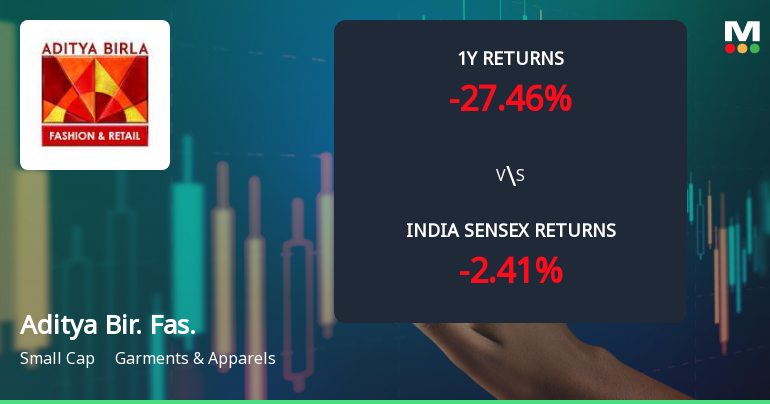
Aditya Birla Fashion & Retail Ltd Technical Momentum Shifts Amid Mixed Market Signals
Aditya Birla Fashion & Retail Ltd (ABFRL) has experienced a notable shift in its price momentum and technical indicators, reflecting a complex market sentiment. Despite a recent 3.23% rise in the stock price to ₹63.90, the company’s technical parameters reveal a blend of mildly bearish and bullish signals, underscoring a cautious outlook for investors in the garments and apparels sector.
Read full news article Announcements
Aditya Birla Fashion and Retail Limited - ESOP/ESOS/ESPS
03-Dec-2019 | Source : NSEAditya Birla Fashion and Retail Limited has informed the Exchange regarding Grant of 4461261 Options.
Aditya Birla Fashion and Retail Limited - Analysts/Institutional Investor Meet/Con. Call Updates
22-Nov-2019 | Source : NSEAditya Birla Fashion and Retail Limiteded has informed the Exchange regarding Analysts/Institutional Investor Meet/Con. Call Updates
Aditya Birla Fashion and Retail Limited - Updates
13-Nov-2019 | Source : NSEAditya Birla Fashion and Retail Limited has informed the Exchange regarding 'allotment of 5,000 rated, listed, nonconvertible,redeemable, unsecured NCDs of ₹10,00,000 each aggregating to ₹ 500 Crore (Rupees Five Hundred Crore only), on private placement basis'.
Corporate Actions

No Upcoming Board Meetings

No Dividend history available

No Splits history available

No Bonus history available

Aditya Birla Fashion & Retail Ltd has announced 9:77 rights issue, ex-date: 30 Jun 20
Quality key factors
Valuation key factors
Technicals key factors
 Technical Indicator Scale: Bearish, Mildly Bearish, Sideways, Mildly Bullish, Bullish Turned
 Shareholding Snapshot : Mar 2026
Shareholding Compare (%holding)
Promoters
None
Held by 34 Schemes (5.61%)
Held by 182 FIIs (15.52%)
Birla Group Holdings Private Limited (17.4%)
Caladium Investment Pte. Ltd. (4.94%)
20.88%
Quarterly Results Snapshot (Consolidated) - Dec'25 - YoY

YoY Growth in quarter ended Dec 2025 is 7.87% vs -47.19% in Dec 2024

YoY Growth in quarter ended Dec 2025 is -196.69% vs 34.11% in Dec 2024
Half Yearly Results Snapshot (Consolidated) - Sep'25
Growth in half year ended Sep 2025 is 11.02% vs -46.52% in Sep 2024
Growth in half year ended Sep 2025 is -54.50% vs 4.04% in Sep 2024
Nine Monthly Results Snapshot (Consolidated) - Dec'25
YoY Growth in nine months ended Dec 2025 is 9.79% vs -46.78% in Dec 2024
YoY Growth in nine months ended Dec 2025 is -74.83% vs 9.91% in Dec 2024
Annual Results Snapshot (Consolidated) - Mar'25
YoY Growth in year ended Mar 2025 is 14.18% vs -48.13% in Mar 2024
YoY Growth in year ended Mar 2025 is 40.16% vs -1,644.50% in Mar 2024
About Aditya Birla Fashion & Retail Ltd

Company Coordinates


