
Compare Vedant Fashions with Similar Stocks
Dashboard
Poor long term growth as Net Sales has grown by an annual rate of 9.22% and Operating profit at 3.99% over the last 5 years
Flat results in Mar 26
With ROE of 26.4, it has a Expensive valuation with a 6.6 Price to Book Value
Consistent Underperformance against the benchmark over the last 3 years
Stock DNA
Garments & Apparels
INR 10,001 Cr (Small Cap)
25.00
78
1.95%
-0.16
26.38%
6.54
Total Returns (Price + Dividend) 
Latest dividend: 8 per share ex-dividend date: Aug-28-2025
Risk Adjusted Returns v/s
Returns Beta

News

Vedant Fashions Ltd is Rated Sell
Vedant Fashions Ltd is rated 'Sell' by MarketsMOJO, with this rating last updated on 26 May 2025. However, the analysis and financial metrics discussed here reflect the stock's current position as of 24 June 2026, providing investors with an up-to-date view of the company's performance and outlook.
Read full news article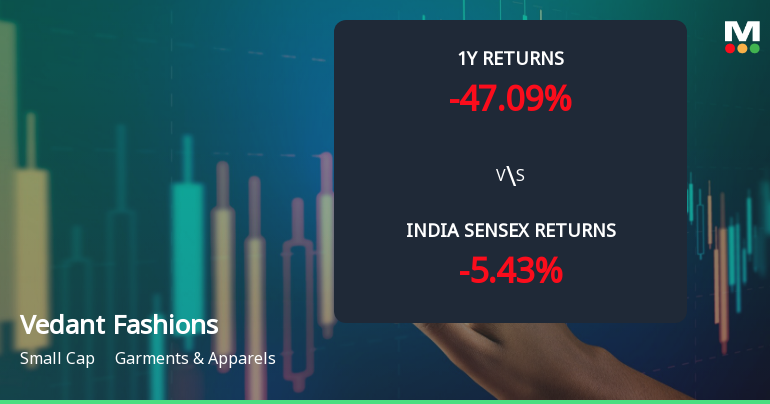
Vedant Fashions Ltd Technical Momentum Shifts Amid Prolonged Downtrend
Vedant Fashions Ltd, a small-cap player in the Garments & Apparels sector, has exhibited a subtle shift in its technical momentum, moving from a strongly bearish stance to a mildly bearish trend. Despite a modest day gain of 0.69% to close at ₹413.05, the stock remains deeply entrenched in a prolonged downtrend, with year-to-date returns at -28.99% and a one-year decline of 47.09%, significantly underperforming the Sensex benchmarks.
Read full news article
Vedant Fashions Ltd Technical Momentum Shifts Amid Bearish Sentiment
Vedant Fashions Ltd, a small-cap player in the Garments & Apparels sector, has experienced a notable shift in its technical momentum, moving from a mildly bearish to a bearish trend. Despite a modest intraday price range between ₹404.00 and ₹421.85, the stock closed lower at ₹410.20, down 0.45% from the previous close of ₹412.05, reflecting growing investor caution amid mixed technical signals and a challenging market backdrop.
Read full news article Announcements
Corporate Actions

No Upcoming Board Meetings

Vedant Fashions Ltd has declared 800% dividend, ex-date: 28 Aug 25

No Splits history available

No Bonus history available

No Rights history available
Quality key factors
Valuation key factors
Technicals key factors
 Technical Indicator Scale: Bearish, Mildly Bearish, Sideways, Mildly Bullish, Bullish Turned
 Shareholding Snapshot : Mar 2026
Shareholding Compare (%holding)
Promoters
None
Held by 21 Schemes (10.02%)
Held by 114 FIIs (8.29%)
Ravi Modi Family Trust (acting Through Its Trustees, Modi Fiduciary Services Private Limited) (57.15%)
Government Pension Fund Global (3.65%)
3.4%
Quarterly Results Snapshot (Standalone) - Mar'26 - QoQ

QoQ Growth in quarter ended Mar 2026 is -18.77% vs 86.86% in Dec 2025
QoQ Growth in quarter ended Mar 2026 is -15.27% vs 140.55% in Dec 2025
Half Yearly Results Snapshot (Standalone) - Sep'25

Growth in half year ended Sep 2025 is 7.20% vs -4.03% in Sep 2024
Growth in half year ended Sep 2025 is -2.36% vs -8.44% in Sep 2024
Nine Monthly Results Snapshot (Standalone) - Dec'25
YoY Growth in nine months ended Dec 2025 is 1.67% vs 1.55% in Dec 2024
YoY Growth in nine months ended Dec 2025 is -9.09% vs -3.90% in Dec 2024
Annual Results Snapshot (Standalone) - Mar'26
YoY Growth in year ended Mar 2026 is 3.53% vs 1.39% in Mar 2025
YoY Growth in year ended Mar 2026 is -3.33% vs -6.21% in Mar 2025
About Vedant Fashions Ltd

Company Coordinates


