
Compare V2 Retail with Similar Stocks
Dashboard
Healthy long term growth as Net Sales has grown by an annual rate of 41.61% and Operating profit at 109.81%
With a growth in Net Profit of 171.89%, the company declared Very Positive results in Mar 26
With ROCE of 14.5, it has a Fair valuation with a 5 Enterprise value to Capital Employed
Majority shareholders : Promoters
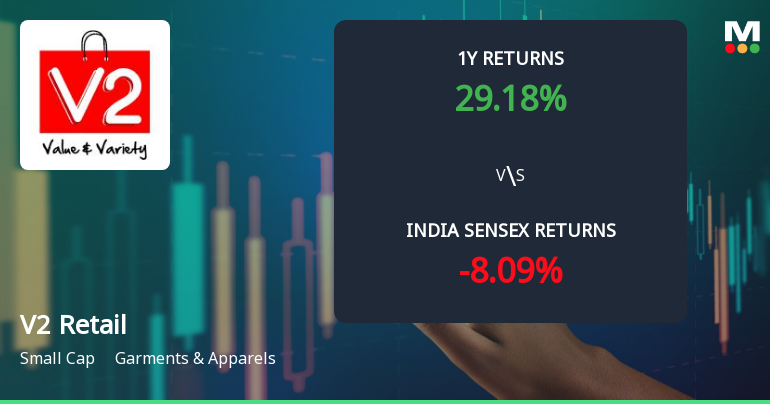
Consistent Returns over the last 3 years
Stock DNA
Garments & Apparels
INR 8,292 Cr (Small Cap)
59.00
77
0.00%
1.09
15.68%
9.29
Total Returns (Price + Dividend) 
V2 Retail for the last several years.
Risk Adjusted Returns v/s
Returns Beta

News
V2 Retail Ltd Technical Momentum Shifts Signal Mildly Bullish Outlook
V2 Retail Ltd, a small-cap player in the Garments & Apparels sector, has exhibited a notable shift in its technical momentum, signalling a cautiously optimistic outlook for investors. The stock’s recent price action, combined with mixed but improving technical indicators, suggests a transition from a purely bullish stance to a mildly bullish trend, reflecting nuanced market sentiment amid broader sector dynamics.
Read full news article
MarketsMOJO Upgrades V2 Retail Ltd to Buy on Strong Financial and Technical Performance
V2 Retail Ltd has been upgraded from Hold to Buy following a comprehensive reassessment of its quality, valuation, financial trends, and technical indicators. The company’s robust quarterly results, sustained growth trajectory, and improving market signals have collectively driven this positive revision, signalling renewed investor confidence in this small-cap garment and apparel player.
Read full news article
V2 Retail Ltd Technical Momentum Shifts Signal Bullish Outlook
V2 Retail Ltd has demonstrated a notable shift in its technical momentum, moving from a mildly bullish stance to a more confident bullish trend. This change is underscored by key technical indicators such as the MACD, moving averages, and Bollinger Bands, signalling renewed investor interest in this small-cap garment and apparel stock. With a current price of ₹228.10 and a recent day gain of 2.93%, the stock is poised for potential further upside amid mixed but improving technical signals.
Read full news article Announcements
V2 Retail Limited - Updates
13-Nov-2019 | Source : NSEV2 Retail Limited has informed the Exchange regarding 'Intimation for incorporation of wholly owned subsidiary of the Company '.
Shareholders meeting
09-Sep-2019 | Source : NSE
| V2 Retail Limited has informed the Exchange regarding Proceedings of Annual General Meeting held on September 07, 2019 |
Updates
08-Aug-2019 | Source : NSE
| V2 Retail Limited has informed the Exchange regarding 'Submission of Newspaper cutting pertaining to 18th Annual General Meeting ??AGM?? Notice published in Newspapers'. |
Corporate Actions

No Upcoming Board Meetings

No Dividend history available

V2 Retail Ltd has announced 1:10 stock split, ex-date: 25 Mar 26

No Bonus history available

No Rights history available
Quality key factors
Valuation key factors
Technicals key factors
 Technical Indicator Scale: Bearish, Mildly Bearish, Sideways, Mildly Bullish, Bullish Turned
 Shareholding Snapshot : Mar 2026
Shareholding Compare (%holding)
Promoters
1.7862
Held by 9 Schemes (8.34%)
Held by 75 FIIs (2.59%)
Ricon Commodities Private Limited (35.28%)
Motilal Oswal Large And Midcap Fund (7.11%)
28.07%
Quarterly Results Snapshot (Consolidated) - Mar'26 - YoY

YoY Growth in quarter ended Mar 2026 is 59.88% vs 68.39% in Mar 2025

YoY Growth in quarter ended Mar 2026 is 171.89% vs 78.89% in Mar 2025
Half Yearly Results Snapshot (Consolidated) - Sep'25
Growth in half year ended Sep 2025 is 68.65% vs 60.64% in Sep 2024
Growth in half year ended Sep 2025 is 190.90% vs 2,566.67% in Sep 2024
Nine Monthly Results Snapshot (Consolidated) - Dec'25
YoY Growth in nine months ended Dec 2025 is 63.79% vs 59.55% in Dec 2024
YoY Growth in nine months ended Dec 2025 is 120.38% vs 172.04% in Dec 2024
Annual Results Snapshot (Consolidated) - Mar'26
YoY Growth in year ended Mar 2026 is 62.75% vs 61.80% in Mar 2025
YoY Growth in year ended Mar 2026 is 124.99% vs 159.01% in Mar 2025
About V2 Retail Ltd

Company Coordinates


