
Compare Aditya Birla Cap with Similar Stocks
Dashboard
Strong Long Term Fundamental Strength with a 26.03% CAGR growth in Operating Profits
Healthy long term growth as Operating profit has grown by an annual rate of 26.03%
Positive results in Mar 26
With ROE of 11, it has a Fair valuation with a 2.9 Price to Book Value
High Institutional Holdings at 21.52%
Stock DNA
Non Banking Financial Company (NBFC)
INR 102,488 Cr (Mid Cap)
26.00
21
0.00%
5.22
11.05%
2.99
Total Returns (Price + Dividend) 
Aditya Birla Cap for the last several years.
Risk Adjusted Returns v/s
Returns Beta

News
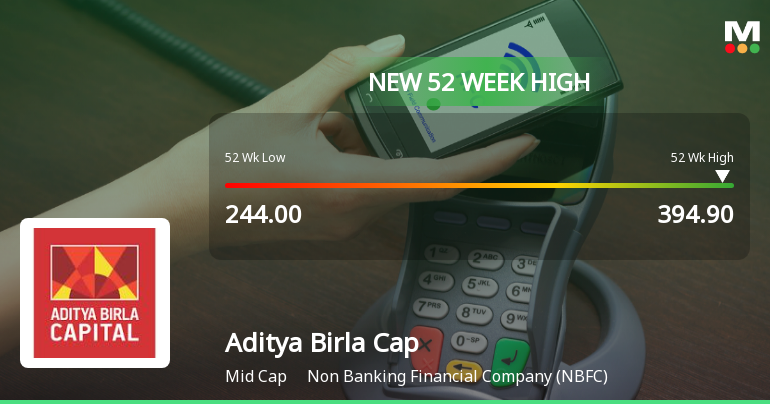
Broad-Based Technical Strength Lifts Aditya Birla Capital Ltd to 52-Week High of Rs 394.9
With every major technical indicator aligned to the upside, Aditya Birla Capital Ltd surged to a fresh 52-week high of Rs 394.9 on 23 Jun 2026, marking a significant milestone in its price momentum journey.
Read full news article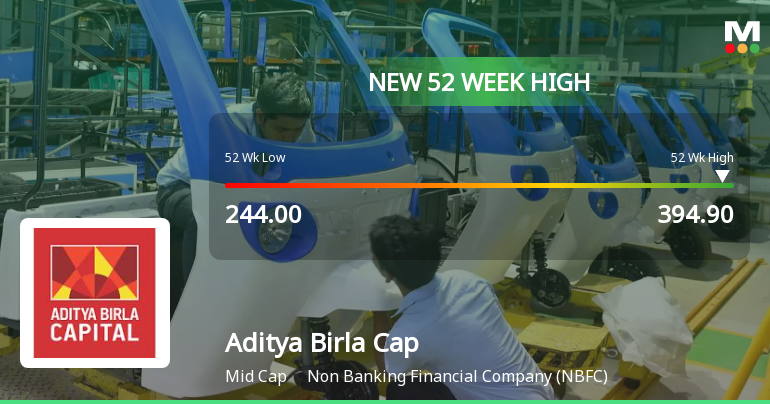
Broad-Based Technical Strength Lifts Aditya Birla Capital Ltd to 52-Week High of Rs 394.9
Surpassing its previous peak, Aditya Birla Capital Ltd touched a new 52-week high of Rs 394.9 on 23 Jun 2026, marking a significant milestone in its price momentum. This achievement comes amid a backdrop of sustained technical strength and a market environment where the Sensex has been steadily advancing over the past three weeks.
Read full news article
Announcements
Announcement under Regulation 30 (LODR)-Analyst / Investor Meet - Intimation
18-Jun-2026 | Source : BSEAditya Birla Capital Limited has informed the exchange about the schedule of the meet
Announcement under Regulation 30 (LODR)-Allotment
16-Jun-2026 | Source : BSEAditya Birla Capital Limited has informed the Stock Exchange regarding allotment of its Non-Convertible Debentures
Shareholder Meeting / Postal Ballot-Outcome of EGM
12-Jun-2026 | Source : BSEAditya Birla Capital Limited has informed the exchange regarding proceedings of Extra Ordinary General Meeting held on 12 June 2026. Further the Company has submitted the exchange a copy of Scrutinizers Report along with Voting Results.
Corporate Actions

No Upcoming Board Meetings

No Dividend history available

No Splits history available

No Bonus history available

No Rights history available
Quality key factors
Valuation key factors
Technicals key factors
 Technical Indicator Scale: Bearish, Mildly Bearish, Sideways, Mildly Bullish, Bullish Turned
 Shareholding Snapshot : Mar 2026
Shareholding Compare (%holding)
Promoters
None
Held by 64 Schemes (6.57%)
Held by 419 FIIs (7.02%)
Grasim Industries Limited (52.29%)
Pi Opportunities Fund I (3.03%)
7.34%
Quarterly Results Snapshot (Consolidated) - Mar'26 - YoY

YoY Growth in quarter ended Mar 2026 is 10.19% vs 13.31% in Mar 2025

YoY Growth in quarter ended Mar 2026 is 30.60% vs -30.58% in Mar 2025
Half Yearly Results Snapshot (Consolidated) - Sep'25
Growth in half year ended Sep 2025 is 5.81% vs 30.31% in Sep 2024
Growth in half year ended Sep 2025 is -3.94% vs 29.98% in Sep 2024
Nine Monthly Results Snapshot (Consolidated) - Dec'25
YoY Growth in nine months ended Dec 2025 is 12.95% vs 21.39% in Dec 2024
YoY Growth in nine months ended Dec 2025 is 6.79% vs 18.10% in Dec 2024
Annual Results Snapshot (Consolidated) - Mar'26
YoY Growth in year ended Mar 2026 is 12.12% vs 19.59% in Mar 2025
YoY Growth in year ended Mar 2026 is 12.97% vs -0.08% in Mar 2025
About Aditya Birla Capital Ltd

Company Coordinates


