
Compare Tata Capital with Similar Stocks
Dashboard
Strong Long Term Fundamental Strength with a 0% CAGR growth in Operating Profits
Healthy long term growth as Net Sales has grown by an annual rate of 0% and Operating profit at 0%
The company has declared Positive results for the last 2 consecutive quarters
With ROE of 10.6, it has a Expensive valuation with a 3.3 Price to Book Value
Increasing Participation by Institutional Investors
Stock DNA
Non Banking Financial Company (NBFC)
INR 152,964 Cr (Large Cap)
31.00
NA
0.00%
5.15
10.64%
3.35
Total Returns (Price + Dividend) 
Tata Capital for the last several years.
Risk Adjusted Returns v/s
Returns Beta

News

Tata Capital Ltd Upgraded to Hold by MarketsMOJO on Improved Technicals and Financials
Tata Capital Ltd, a prominent player in the Non Banking Financial Company (NBFC) sector, has seen its investment rating upgraded from Sell to Hold as of 1 July 2026. This change reflects a nuanced improvement across technical indicators, valuation metrics, financial trends, and overall quality assessments, signalling a cautious but optimistic stance for investors amid steady operational performance and evolving market dynamics.
Read full news article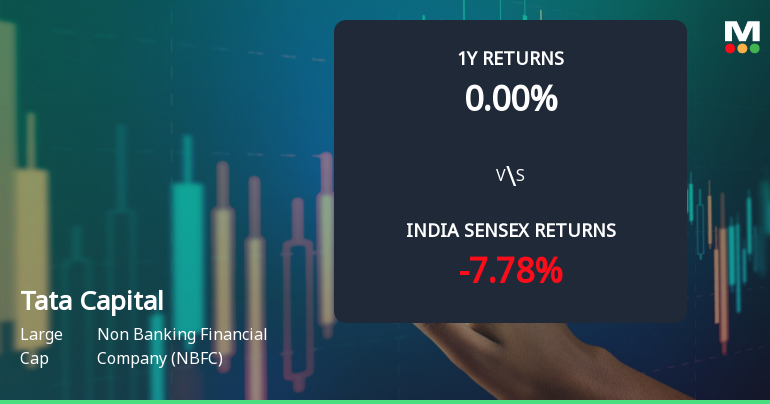
Tata Capital Ltd Technical Momentum Shifts to Mildly Bullish Amid Market Volatility
Tata Capital Ltd has experienced a notable shift in its technical momentum, moving from a mildly bearish stance to a mildly bullish outlook. This change coincides with an upgrade in its Mojo Grade from Sell to Hold as of 1 July 2026, reflecting improving market sentiment despite a modest day decline of 1.11%. Investors and analysts are closely monitoring key technical indicators such as MACD, RSI, and moving averages to assess the stock’s near-term trajectory within the Non Banking Financial Company (NBFC) sector.
Read full news article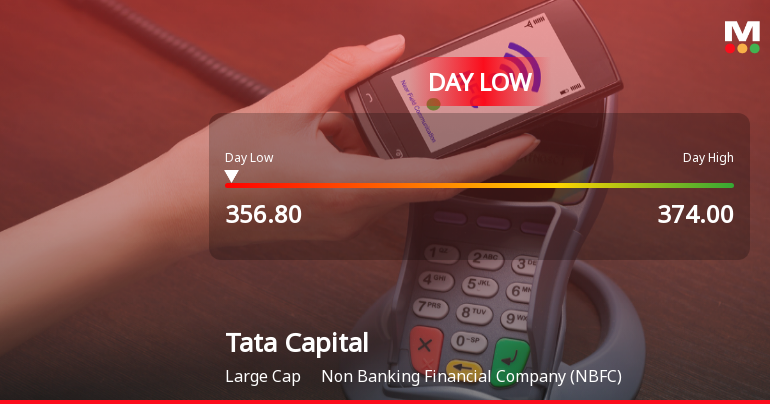
Tata Capital Ltd Hits Intraday Low Amid Price Pressure on 30 Jun 2026
Tata Capital Ltd experienced a notable decline today, touching an intraday low of Rs 359.05 as the stock faced significant price pressure amid a broadly subdued market environment. The stock underperformed its sector and the broader Sensex index, reflecting immediate selling pressures and cautious market sentiment.
Read full news article Announcements
Corporate Actions

No Upcoming Board Meetings

No Dividend history available

No Splits history available

No Bonus history available

No Rights history available
Quality key factors
Valuation key factors
Technicals key factors
 Technical Indicator Scale: Bearish, Mildly Bearish, Sideways, Mildly Bullish, Bullish Turned
 Shareholding Snapshot : Mar 2026
Shareholding Compare (%holding)
Promoters
None
Held by 31 Schemes (1.85%)
Held by 104 FIIs (4.88%)
Tata Sons Private Limited (78.8%)
None
4.66%
Quarterly Results Snapshot (Standalone) - Mar'26 - QoQ

QoQ Growth in quarter ended Mar 2026 is 5.65% vs 3.56% in Dec 2025
QoQ Growth in quarter ended Mar 2026 is 49.72% vs 19.57% in Dec 2025
Half Yearly Results Snapshot (Consolidated) - Sep'25

Growth in half year ended Sep 2025 is 12.17% vs 65.55% in Sep 2024
Growth in half year ended Sep 2025 is 35.76% vs -0.08% in Sep 2024
Nine Monthly Results Snapshot (Consolidated) - Dec'25
YoY Growth in nine months ended Dec 2025 is 12.21% vs 26.62% in Dec 2024
YoY Growth in nine months ended Dec 2025 is 27.98% vs -14.07% in Dec 2024
Annual Results Snapshot (Consolidated) - Mar'26
YoY Growth in year ended Mar 2026 is 11.40% vs 55.77% in Mar 2025
YoY Growth in year ended Mar 2026 is 32.24% vs 16.33% in Mar 2025
About Tata Capital Ltd

Company Coordinates


