
Compare Aditya Birla Cap with Similar Stocks
Dashboard
Strong Long Term Fundamental Strength with a 26.03% CAGR growth in Operating Profits
Healthy long term growth as Operating profit has grown by an annual rate of 26.03%
Positive results in Mar 26
With ROE of 11, it has a Fair valuation with a 3 Price to Book Value
High Institutional Holdings at 21.52%
Stock DNA
Non Banking Financial Company (NBFC)
INR 101,164 Cr (Mid Cap)
27.00
21
0.00%
5.22
11.05%
2.92
Total Returns (Price + Dividend) 
Aditya Birla Cap for the last several years.
Risk Adjusted Returns v/s
Returns Beta

News
Aditya Birla Capital Sees Sharp Open Interest Surge Amid Bullish Momentum
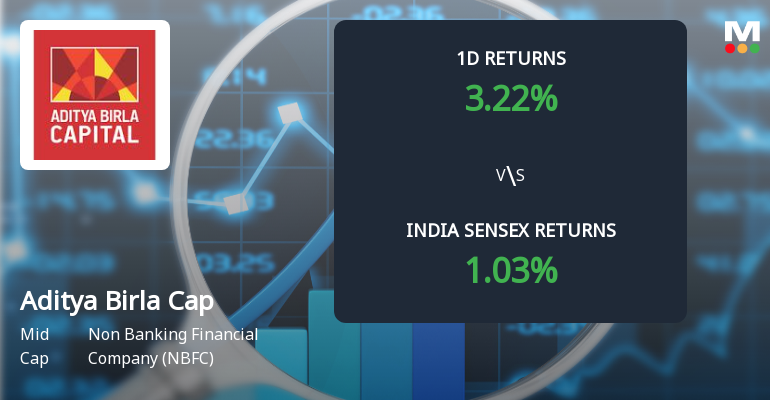
Aditya Birla Capital Ltd (ABCAPITAL) has witnessed a notable surge in open interest in its derivatives segment, signalling increased market participation and potential directional bets. The stock recently hit a new 52-week and all-time high of Rs 396.5, supported by robust volume and positive price action, outperforming its sector peers and the broader Sensex.
Read full news article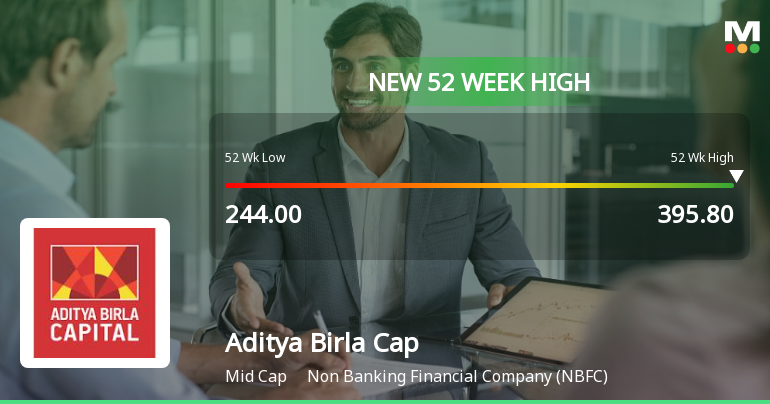
Broad-Based Technical Strength Lifts Aditya Birla Capital Ltd to 52-Week High of Rs 396.55
With a decisive surge to Rs 396.55 on 24 Jun 2026, Aditya Birla Capital Ltd has reached a fresh 52-week and all-time high, marking a 46.0% rally from its low of Rs 244 over the past year. This milestone reflects a powerful alignment of technical indicators and sustained price momentum that has propelled the stock well ahead of the broader market’s modest gains.
Read full news article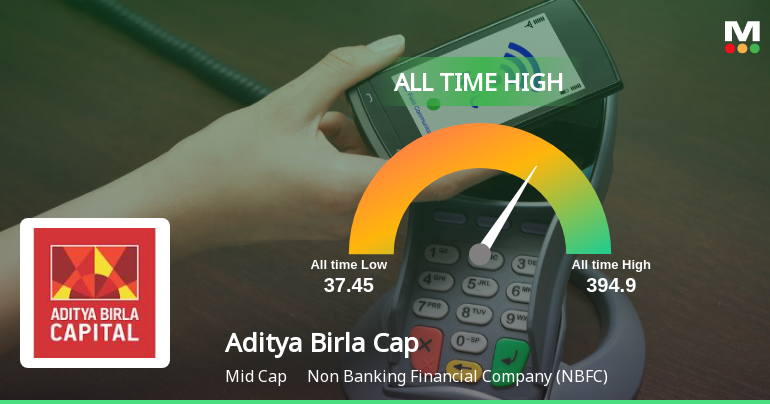
Announcements
Announcement under Regulation 30 (LODR)-Allotment
23-Jun-2026 | Source : BSEAditya Birla Capital Limited has informed the Exchange regarding allotment of equity shares on 23 June 2026 pursuant to Preferential Issue
Announcement under Regulation 30 (LODR)-Analyst / Investor Meet - Intimation
18-Jun-2026 | Source : BSEAditya Birla Capital Limited has informed the exchange about the schedule of the meet
Announcement under Regulation 30 (LODR)-Allotment
16-Jun-2026 | Source : BSEAditya Birla Capital Limited has informed the Stock Exchange regarding allotment of its Non-Convertible Debentures
Corporate Actions

No Upcoming Board Meetings

No Dividend history available

No Splits history available

No Bonus history available

No Rights history available
Quality key factors
Valuation key factors
Technicals key factors
 Technical Indicator Scale: Bearish, Mildly Bearish, Sideways, Mildly Bullish, Bullish Turned
 Shareholding Snapshot : Mar 2026
Shareholding Compare (%holding)
Promoters
None
Held by 64 Schemes (6.57%)
Held by 419 FIIs (7.02%)
Grasim Industries Limited (52.29%)
Pi Opportunities Fund I (3.03%)
7.34%
Quarterly Results Snapshot (Consolidated) - Mar'26 - YoY

YoY Growth in quarter ended Mar 2026 is 10.19% vs 13.31% in Mar 2025

YoY Growth in quarter ended Mar 2026 is 30.60% vs -30.58% in Mar 2025
Half Yearly Results Snapshot (Consolidated) - Sep'25
Growth in half year ended Sep 2025 is 5.81% vs 30.31% in Sep 2024
Growth in half year ended Sep 2025 is -3.94% vs 29.98% in Sep 2024
Nine Monthly Results Snapshot (Consolidated) - Dec'25
YoY Growth in nine months ended Dec 2025 is 12.95% vs 21.39% in Dec 2024
YoY Growth in nine months ended Dec 2025 is 6.79% vs 18.10% in Dec 2024
Annual Results Snapshot (Consolidated) - Mar'26
YoY Growth in year ended Mar 2026 is 12.12% vs 19.59% in Mar 2025
YoY Growth in year ended Mar 2026 is 12.97% vs -0.08% in Mar 2025
About Aditya Birla Capital Ltd

Company Coordinates


