
Compare Advance Petroch. with Similar Stocks
Dashboard
High Debt company with Weak Long Term Fundamental Strength
- Poor long term growth as Operating profit has grown by an annual rate 3.01% of over the last 5 years
- High Debt Company with a Debt to Equity ratio (avg) of 2.52 times
With ROCE of 6.4, it has a Expensive valuation with a 2.2 Enterprise value to Capital Employed
Reducing Promoter Confidence
Stock DNA
Commodity Chemicals
INR 25 Cr (Micro Cap)
1,218.00
13
0.00%
3.29
0.49%
6.11
Total Returns (Price + Dividend) 
Advance Petroch. for the last several years.
Risk Adjusted Returns v/s
Returns Beta

News
Advance Petrochemicals Ltd Downgraded to Sell Amid Mixed Financial and Technical Signals
Advance Petrochemicals Ltd has seen its investment rating downgraded from Hold to Sell, reflecting a complex interplay of deteriorating financial fundamentals, cautious valuation metrics, and shifting technical indicators. Despite strong recent returns, concerns over high debt levels, weakening promoter confidence, and mixed technical trends have prompted a reassessment of the stock’s outlook.
Read full news article
Advance Petrochemicals Ltd Upgraded to Hold on Improved Technicals and Valuation
Advance Petrochemicals Ltd has seen its investment rating upgraded from Sell to Hold as of 5 June 2026, reflecting notable improvements in its technical indicators and valuation metrics. Despite a micro-cap status and some lingering concerns over long-term fundamentals, the company’s recent financial performance and market behaviour have prompted a reassessment of its outlook.
Read full news article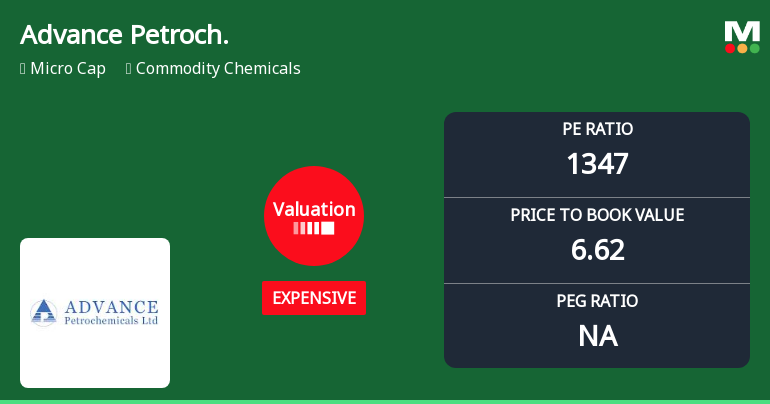
Advance Petrochemicals Ltd Valuation Shifts Signal Expensive Market Position
Advance Petrochemicals Ltd has witnessed a marked shift in its valuation parameters, moving from a risky to an expensive profile, despite delivering robust returns well above benchmark indices. This article analyses the recent changes in key valuation metrics such as price-to-earnings (P/E) and price-to-book value (P/BV) ratios, compares them with peer averages, and assesses the implications for investors navigating this micro-cap commodity chemicals stock.
Read full news article Announcements
Board Meeting Outcome for Revised Outcome For Audited Standalone Financial Results For The Quarter And Financial Year Ended As On 31St March 2026
06-Jun-2026 | Source : BSERevised outcome With regard to the captioned subject and in compliance with the Regulation 30 and 33 of SEBI (Listing Obligations and Disclosure Requirements) Regulations 2015 this is to inform you that a meeting of Board of Directors was held today inter-alia Saturday 23rd May 2026 at the registered office of the company which commenced at 04:30 p.m. and concluded at 05:00 p.m. and the Board considered the following agenda along with other agenda: 1. The Board Adopted Audited Standalone Financial Results for the Quarter and Financial Year ended as on 31st March 2026 along with report of statutory Auditors. 2. Declaration pursuant to Regulation 33(3)(d) of SEBI (LODR) Regulations 2015 in terms of the Audit reports with unmodified opinion.
Revised Audited Standalone Financial Results For The Quarter And Financial Year Ended As On 31St March 2026
06-Jun-2026 | Source : BSERevised Audited standalone financial results for the Quarter and financial year ended as on 31st March 2026 signed by the Managing Director of Advance Petrochemcials Limited
Announcement under Regulation 30 (LODR)-Newspaper Publication
25-May-2026 | Source : BSEPublication of Audited standalone financial results for the quarter and year ended as on 31st March 2026 in western times (English and Gujarati edition)
Corporate Actions

No Upcoming Board Meetings

No Dividend history available

No Splits history available

No Bonus history available

No Rights history available
Quality key factors
Valuation key factors
Technicals key factors
 Technical Indicator Scale: Bearish, Mildly Bearish, Sideways, Mildly Bullish, Bullish Turned
 Shareholding Snapshot : Mar 2026
Shareholding Compare (%holding)
Non Institution
None
Held by 0 Schemes
Held by 0 FIIs
Honest Synthetic Pvt.ltd. (17.5%)
Suspense Escrow Account (10.52%)
59.88%
Quarterly Results Snapshot (Standalone) - Mar'26 - YoY

YoY Growth in quarter ended Mar 2026 is 3.83% vs 37.94% in Mar 2025
YoY Growth in quarter ended Mar 2026 is -7.41% vs 17.39% in Mar 2025
Half Yearly Results Snapshot (Standalone) - Sep'25
Growth in half year ended Sep 2025 is -13.97% vs 34.45% in Sep 2024
Growth in half year ended Sep 2025 is -833.33% vs -40.00% in Sep 2024
Nine Monthly Results Snapshot (Standalone) - Dec'25
YoY Growth in nine months ended Dec 2025 is -9.06% vs 43.68% in Dec 2024
YoY Growth in nine months ended Dec 2025 is -833.33% vs 0.00% in Dec 2024
Annual Results Snapshot (Standalone) - Mar'26
YoY Growth in year ended Mar 2026 is -5.17% vs 41.92% in Mar 2025
YoY Growth in year ended Mar 2026 is -90.00% vs 36.36% in Mar 2025
About Advance Petrochemicals Ltd

Company Coordinates


