
Compare Kobo Biotech with Similar Stocks
Dashboard
Weak Long Term Fundamental Strength as the company has not declared results in the last 6 months
- Poor long term growth as Net Sales has grown by an annual rate of -100.00% and Operating profit at 0% over the last 5 years
- The company has a negative book value of Rs 132.91 crore
Flat results in Jun 24
Risky - No result in last 6 months
Stock DNA
Commodity Chemicals
INR 16 Cr (Micro Cap)
NA (Loss Making)
43
0.00%
-1.05
3.71%
-0.12
Total Returns (Price + Dividend) 
Latest dividend: 1 per share ex-dividend date: Sep-21-2012
Risk Adjusted Returns v/s
Returns Beta

News
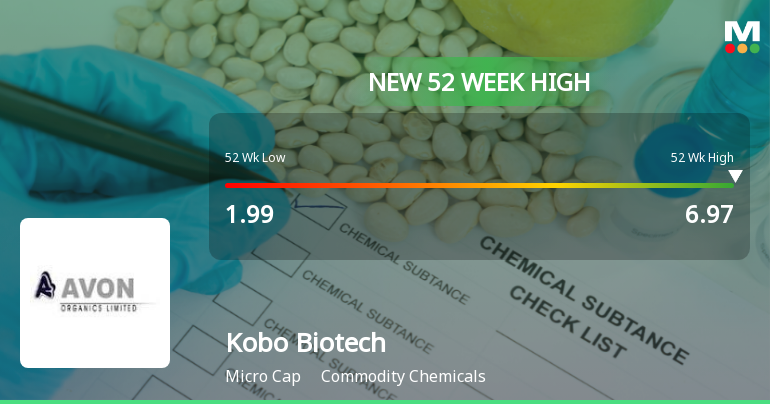
Broad-Based Technical Strength Lifts Kobo Biotech Ltd to 52-Week High of Rs 6.97
Surging past its previous peaks, Kobo Biotech Ltd reached a fresh 52-week high of Rs 6.97 on 19 Jun 2026, marking a remarkable rally of 176.59% over the past year. This milestone comes amid a sustained 21-day winning streak, underscoring the stock’s strong price momentum despite a broadly declining Sensex.
Read full news article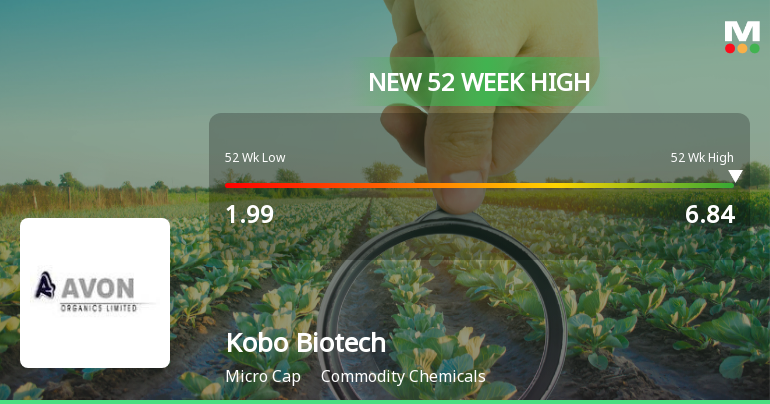
Broad-Based Technical Strength Lifts Kobo Biotech Ltd to 52-Week High of Rs 6.84
Surging from a 52-week low of Rs 1.99 to a fresh high of Rs 6.84 on 18 Jun 2026, Kobo Biotech Ltd has delivered an extraordinary 170.36% return over the past year, vastly outperforming the Sensex’s decline of 5.21%. This remarkable rally is underpinned by a strong alignment of technical indicators and sustained price momentum across multiple timeframes.
Read full news article
Broad-Based Technical Strength Lifts Kobo Biotech Ltd to 52-Week High of Rs 6.71
Surging past its previous peaks, Kobo Biotech Ltd reached a fresh 52-week high of Rs 6.71 today, marking a remarkable 148.52% gain over the past 21 trading days. This rally has propelled the stock well above all key moving averages, underscoring a powerful momentum shift in the commodity chemicals sector.
Read full news article Announcements
Corporate Insolvency Resolution Process (CIRP)-Approval of Resolution plan by Tribunal
13-May-2026 | Source : BSESpacific features and deatils pf the resolution Plan as apprpved by the NCLT
Corporate Insolvency Resolution Process (CIRP)-Approval of Resolution plan by Tribunal
11-May-2026 | Source : BSEApproval of Resolution Plan and receipt of Order from NCLT
Intimation Regarding Non-Applicability Of Large Entity Disclosure
15-Apr-2026 | Source : BSEIntimation Regarding Non Applicability of Large Entity Disclosure
Corporate Actions

No Upcoming Board Meetings

Kobo Biotech Ltd has declared 10% dividend, ex-date: 21 Sep 12

No Splits history available

No Bonus history available

No Rights history available
Quality key factors
Valuation key factors
Technicals key factors
 Technical Indicator Scale: Bearish, Mildly Bearish, Sideways, Mildly Bullish, Bullish Turned
 Shareholding Snapshot : Mar 2026
Shareholding Compare (%holding)
Non Institution
None
Held by 0 Schemes
Held by 0 FIIs
Arch Pharmalabs Ltd (44.95%)
Mehul Pravin Chandra Shah (1.1%)
47.77%
Quarterly Results Snapshot (Standalone) - Jun'24 - QoQ
QoQ Growth in quarter ended Jun 2024 is 0.00% vs 0.00% in Mar 2024

QoQ Growth in quarter ended Jun 2024 is -5.56% vs -2.44% in Mar 2024
Half Yearly Results Snapshot (Standalone) - Sep'23
Growth in half year ended Sep 2023 is 0.00% vs 0.00% in Sep 2022
Growth in half year ended Sep 2023 is 5.06% vs 25.72% in Sep 2022
Nine Monthly Results Snapshot (Standalone) - Dec'23
YoY Growth in nine months ended Dec 2023 is 0.00% vs 0.00% in Dec 2022
YoY Growth in nine months ended Dec 2023 is 2.39% vs 21.83% in Dec 2022
Annual Results Snapshot (Standalone) - Mar'24
YoY Growth in year ended Mar 2024 is 0.00% vs 0.00% in Mar 2023
YoY Growth in year ended Mar 2024 is 11.17% vs 63.56% in Mar 2023
About Kobo Biotech Ltd


