
Compare Aeonx Digital with Similar Stocks
Dashboard
With a Operating Losses, the company has a Weak Long Term Fundamental Strength
- Company's ability to service its debt is weak with a poor EBIT to Interest (avg) ratio of -1.58
- The company has been able to generate a Return on Equity (avg) of 4.01% signifying low profitability per unit of shareholders funds
Flat results in Mar 26
Risky - Negative EBITDA
Below par performance in long term as well as near term
Stock DNA
Non - Ferrous Metals
INR 51 Cr (Micro Cap)
292.00
43
0.90%
-0.11
0.33%
0.99
Total Returns (Price + Dividend) 
Latest dividend: 1 per share ex-dividend date: Sep-16-2025
Risk Adjusted Returns v/s
Returns Beta

News

Aeonx Digital Technology Ltd is Rated Strong Sell
Aeonx Digital Technology Ltd is rated Strong Sell by MarketsMOJO. This rating was last updated on 04 Dec 2025, reflecting a significant reassessment of the stock’s outlook. However, the analysis and financial metrics discussed here represent the company’s current position as of 18 June 2026, providing investors with the latest insights into its performance and prospects.
Read full news articleAre Aeonx Digital Technology Ltd latest results good or bad?
Aeonx Digital Technology Ltd's latest financial results for Q4 FY26 reveal significant operational challenges despite a notable increase in revenue. The company reported net sales of ₹16.53 crores, reflecting a year-on-year growth of 72.91% and a quarter-on-quarter increase of 4.03%. However, this top-line growth was overshadowed by a net loss of ₹0.79 crores, marking a stark contrast to the profit of ₹1.33 crores in the same quarter last year. The operational metrics indicate a troubling trend, with the operating margin plummeting to -11.62%, the lowest in the past seven quarters. This decline suggests severe operational stress, primarily driven by a substantial rise in employee costs, which constituted 32.24% of revenues. This increase in personnel expenses, combined with other operating costs, has raised concerns about the sustainability of the company's business model. The financial performance has de...
Read full news article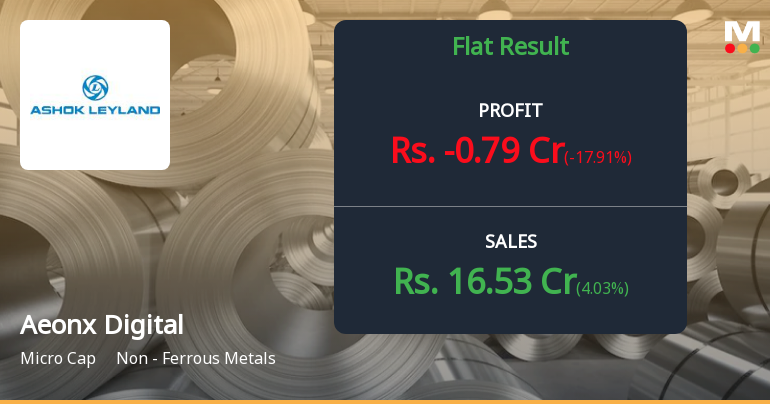
Aeonx Digital Technology Q4 FY26: Losses Deepen as Operating Margins Turn Negative
Aeonx Digital Technology Ltd., formerly known as Ashok Alco-Chem Ltd., reported deeply concerning Q4 FY26 results with net losses widening to ₹0.79 crores—marking a dramatic reversal from the ₹1.33 crores profit recorded in Q4 FY25. The micro-cap company, with a market capitalisation of ₹57.00 crores, witnessed operating margins plunge into negative territory at -11.62% as employee costs surged whilst revenues remained relatively flat. The stock has reacted negatively, trading at ₹125.00 on May 27, 2026, down 48.35% from its 52-week high of ₹242.00.
Read full news article Announcements
Compliances-Reg.24(A)-Annual Secretarial Compliance
29-May-2026 | Source : BSEEnclosed
Announcement under Regulation 30 (LODR)-Newspaper Publication
28-May-2026 | Source : BSENewspaper Publication of Audited (Standalone & Consolidated) Financials Results for the quarter & year ended 31st March 2026.
Outcome Of Board Meeting Held On 26.05.2026
28-May-2026 | Source : BSEEnclosed
Corporate Actions

No Upcoming Board Meetings

Aeonx Digital Technology Ltd has declared 10% dividend, ex-date: 16 Sep 25

No Splits history available

No Bonus history available

No Rights history available
Quality key factors
Valuation key factors
Technicals key factors
 Technical Indicator Scale: Bearish, Mildly Bearish, Sideways, Mildly Bullish, Bullish Turned
 Shareholding Snapshot : Mar 2026
Shareholding Compare (%holding)
Promoters
None
Held by 0 Schemes
Held by 1 FIIs (0.08%)
Aura Alkalies And Chemicals Pvt. Ltd. (54.75%)
Kodai Investment And Trading Company Private Limited (4.27%)
32.1%
Quarterly Results Snapshot (Consolidated) - Mar'26 - QoQ

QoQ Growth in quarter ended Mar 2026 is 4.03% vs 49.34% in Dec 2025

QoQ Growth in quarter ended Mar 2026 is -17.91% vs -291.43% in Dec 2025
Half Yearly Results Snapshot (Consolidated) - Sep'25
Growth in half year ended Sep 2025 is 60.60% vs 9.48% in Sep 2024
Growth in half year ended Sep 2025 is -55.32% vs 347.62% in Sep 2024
Nine Monthly Results Snapshot (Consolidated) - Dec'25
YoY Growth in nine months ended Dec 2025 is 69.47% vs 4.21% in Dec 2024
YoY Growth in nine months ended Dec 2025 is -93.73% vs 13,650.00% in Dec 2024
Annual Results Snapshot (Consolidated) - Mar'26
YoY Growth in year ended Mar 2026 is 70.38% vs 1.46% in Mar 2025
YoY Growth in year ended Mar 2026 is -115.31% vs 48.35% in Mar 2025
About Aeonx Digital Technology Ltd

Company Coordinates


