
Compare Aequs with Similar Stocks
Dashboard
With a Operating Losses, the company has a Weak Long Term Fundamental Strength
- Poor long term growth as Operating profit has grown by an annual rate 0% of over the last 5 years
- Company's ability to service its debt is weak with a poor EBIT to Interest (avg) ratio of 0
Flat results in Mar 26
Risky - Negative Operating Profits
Stock DNA
Industrial Manufacturing
INR 15,248 Cr (Small Cap)
NA (Loss Making)
39
0.00%
0.23
-7.10%
10.41
Total Returns (Price + Dividend) 
Aequs for the last several years.
Risk Adjusted Returns v/s
Returns Beta

News
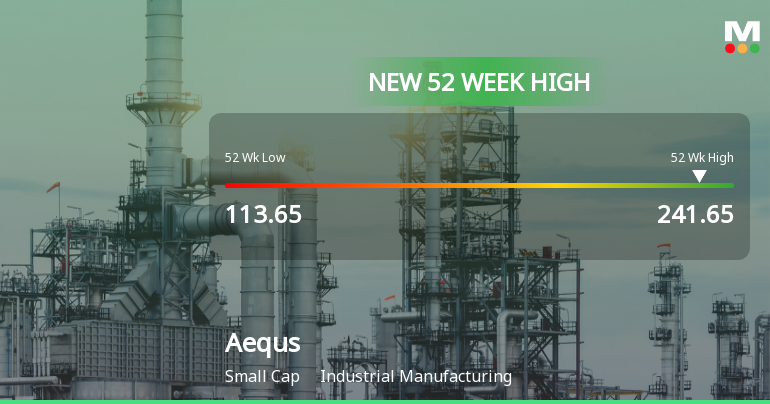
Broad-Based Technical Strength Lifts Aequs Ltd to 52-Week High of Rs 241.65
Surging to an intraday peak of Rs 241.65 on 23 Jun 2026, Aequs Ltd has reached a fresh 52-week high, marking a significant milestone in its price momentum. This breakout comes amid a backdrop of broad technical alignment and sustained upward trends across multiple moving averages, underscoring the stock’s robust price action despite a slight pullback on the day.
Read full news article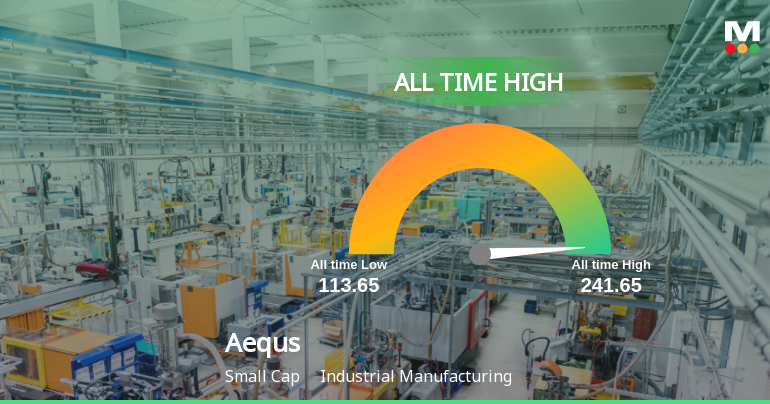
Aequs Ltd Hits All-Time High of Rs 241.65 as Momentum Builds Across Timeframes
After a sustained rally that has seen Aequs Ltd surge 93.2% over the past three months, the stock touched a fresh all-time high of Rs 241.65 on 23 Jun 2026, marking a significant milestone in its price journey.
Read full news article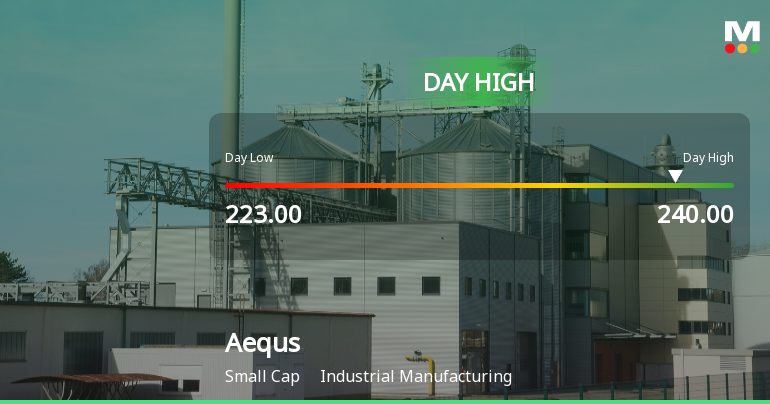
Aequs Ltd Surges 7.26% to Day's High of Rs 240 — Outperforms Sector by 3.61 Percentage Points
The Sensex edged up 0.31% on 22 Jun 2026, but Aequs Ltd outpaced the broader market with a 7.26% gain, touching an intraday high of Rs 240. This 3.61 percentage-point outperformance over its Industrial Manufacturing sector peers signals a distinctly stock-specific rally rather than a market-wide lift.
Read full news article Announcements
Announcement under Regulation 30 (LODR)-Acquisition
19-Jun-2026 | Source : BSEIntimation regarding issue of shares to AeroStructures Manufacturing India Private Limited a wholly owned subsidiary of Aequs Limited by Aequs Aerospace France SAS France (wholly owned step-down subsidiary of Aequs Limited)
Announcement under Regulation 30 (LODR)-Investor Presentation
18-Jun-2026 | Source : BSEInvestor Presentation to be presented at the Investor Day event scheduled today i.e. June 18 2026 at Mumbai.
Announcement under Regulation 30 (LODR)-Analyst / Investor Meet - Intimation
17-Jun-2026 | Source : BSEAequs Limited (Company) has informed the Exchange that management of the Company will be participating in IIFLs 10th Invest India Conference.
Corporate Actions

No Upcoming Board Meetings

No Dividend history available

No Splits history available

No Bonus history available

No Rights history available
Quality key factors
Valuation key factors
Technicals key factors
 Technical Indicator Scale: Bearish, Mildly Bearish, Sideways, Mildly Bullish, Bullish Turned
 Shareholding Snapshot : Mar 2026
Shareholding Compare (%holding)
Promoters
None
Held by 15 Schemes (5.63%)
Held by 18 FIIs (3.9%)
Aequs Manufacturing Investments Private Limited (43.35%)
Amansa Investments Ltd (7.48%)
3.81%
Quarterly Results Snapshot (Standalone) - Mar'26 - QoQ

QoQ Growth in quarter ended Mar 2026 is 18.80% vs 11.07% in Dec 2025
QoQ Growth in quarter ended Mar 2026 is 917.55% vs -3,852.94% in Dec 2025
Half Yearly Results Snapshot (Consolidated) - Sep'25
Not Applicable: The company has declared_date for only one period
Not Applicable: The company has declared_date for only one period
Nine Monthly Results Snapshot (Consolidated) - Dec'25
Not Applicable: The company has declared_date for only one period
Not Applicable: The company has declared_date for only one period
Annual Results Snapshot (Consolidated) - Mar'26
YoY Growth in year ended Mar 2026 is 33.08% vs -4.19% in Mar 2025
YoY Growth in year ended Mar 2026 is -10.65% vs -618.75% in Mar 2025
About Aequs Ltd

Company Coordinates


