
Compare Aether Industri. with Similar Stocks
Dashboard
Company has a Debt to Equity ratio (avg) of 0.06 times
Flat results in Mar 26
With ROCE of 10.2, it has a Very Expensive valuation with a 7 Enterprise value to Capital Employed
Falling Participation by Institutional Investors
Market Beating performance in long term as well as near term
Stock DNA
Specialty Chemicals
INR 19,429 Cr (Small Cap)
88.00
46
0.00%
0.18
9.21%
8.01
Total Returns (Price + Dividend) 
Aether Industri. for the last several years.
Risk Adjusted Returns v/s
Returns Beta

News

Aether Industries Ltd is Rated Hold by MarketsMOJO
Aether Industries Ltd is rated 'Hold' by MarketsMOJO, with this rating last updated on 15 May 2026. However, the analysis and financial metrics discussed here reflect the company’s current position as of 12 July 2026, providing investors with an up-to-date perspective on the stock’s fundamentals, valuation, financial trends, and technical outlook.
Read full news article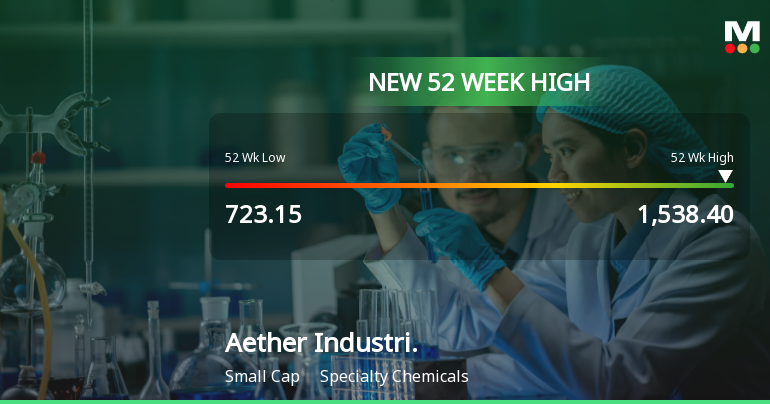
Broad-Based Technical Strength Lifts Aether Industries Ltd to 52-Week High of Rs 1538.4
Surging past its previous peaks, Aether Industries Ltd touched a new 52-week high of Rs 1538.4 on 10 Jul 2026, marking a remarkable 95.1% gain over the past year. This milestone comes amid a sustained rally supported by a confluence of bullish technical indicators and strong price momentum.
Read full news article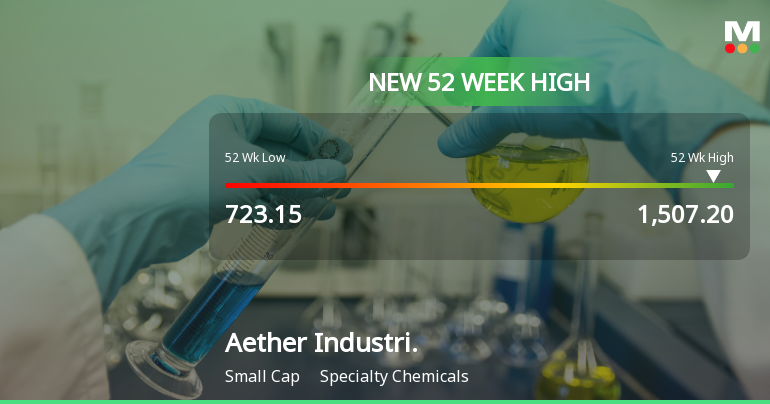
Broad-Based Technical Strength Lifts Aether Industries Ltd to 52-Week High of Rs 1507.2
Surging past its previous peaks, Aether Industries Ltd touched a new 52-week high of Rs 1507.2 on 09 Jul 2026, marking a remarkable 89.7% gain over the past year. This milestone comes amid a backdrop of strong technical momentum and sustained outperformance relative to the broader market.
Read full news article Announcements
Corporate Actions

No Upcoming Board Meetings

No Dividend history available

No Splits history available

No Bonus history available

No Rights history available
Quality key factors
Valuation key factors
Technicals key factors
 Technical Indicator Scale: Bearish, Mildly Bearish, Sideways, Mildly Bullish, Bullish Turned
 Shareholding Snapshot : Jun 2026
Shareholding Compare (%holding)
Promoters
None
Held by 15 Schemes (9.68%)
Held by 103 FIIs (7.42%)
Purnima Ashwin Desai (17.4%)
Sbi Multicap Fund (8.63%)
5.18%
Quarterly Results Snapshot (Consolidated) - Mar'26 - QoQ

QoQ Growth in quarter ended Mar 2026 is -4.29% vs 13.81% in Dec 2025
QoQ Growth in quarter ended Mar 2026 is -16.24% vs 19.50% in Dec 2025
Half Yearly Results Snapshot (Consolidated) - Sep'25

Growth in half year ended Sep 2025 is 40.24% vs 16.46% in Sep 2024
Growth in half year ended Sep 2025 is 56.00% vs -2.65% in Sep 2024
Nine Monthly Results Snapshot (Consolidated) - Dec'25
YoY Growth in nine months ended Dec 2025 is 42.03% vs 24.52% in Dec 2024
YoY Growth in nine months ended Dec 2025 is 53.03% vs 28.84% in Dec 2024
Annual Results Snapshot (Consolidated) - Mar'26
YoY Growth in year ended Mar 2026 is 38.33% vs 40.21% in Mar 2025
YoY Growth in year ended Mar 2026 is 38.53% vs 92.05% in Mar 2025
About Aether Industries Ltd

Company Coordinates


