
Compare Aether Industri. with Similar Stocks
Stock DNA
Specialty Chemicals
INR 16,921 Cr (Small Cap)
80.00
43
0.00%
0.18
9.21%
6.74
Total Returns (Price + Dividend) 
Aether Industri. for the last several years.
Risk Adjusted Returns v/s
Returns Beta

News
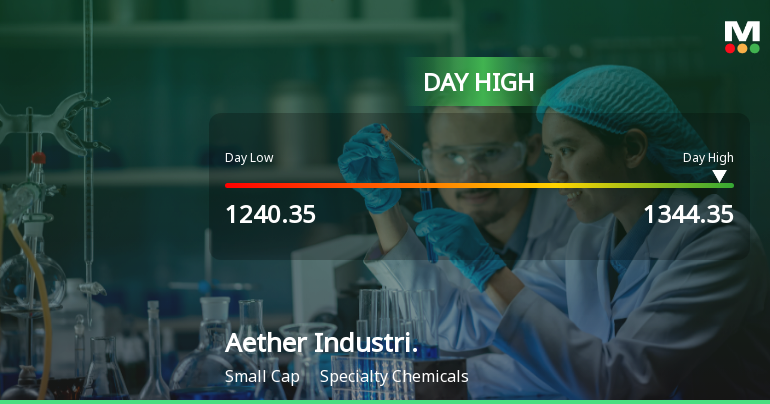
Aether Industries Ltd Surges 7.45% to Day's High of Rs 1325 — Outperforms Sector by 6.88 Percentage Points
The Sensex advanced 0.75% on 24 Jun 2026, yet Aether Industries Ltd outpaced the broader market with a 7.45% gain, reaching an intraday peak of Rs 1325. This 6.88-percentage-point outperformance over its Specialty Chemicals sector peers highlights a distinctly stock-specific rally rather than a market-wide lift.
Read full news article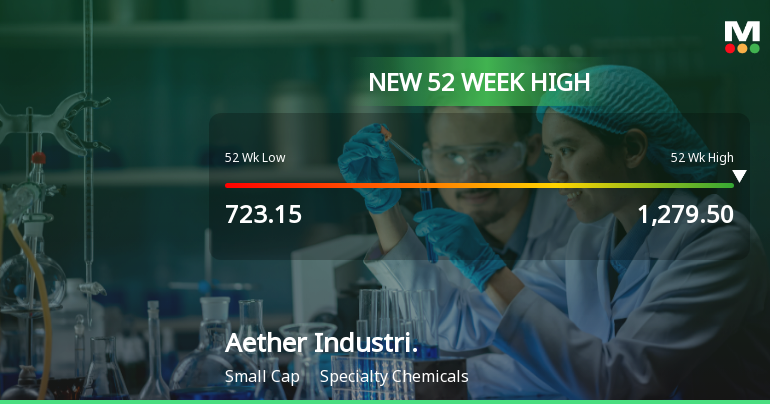
Broad-Based Technical Strength Lifts Aether Industries Ltd to 52-Week High of Rs 1279.5
Surging to an all-time high of Rs 1279.5 on 24 Jun 2026, Aether Industries Ltd has demonstrated remarkable price momentum, outperforming its sector and the broader market with a 65.36% gain over the past year against the Sensex’s decline of 6.85%.
Read full news article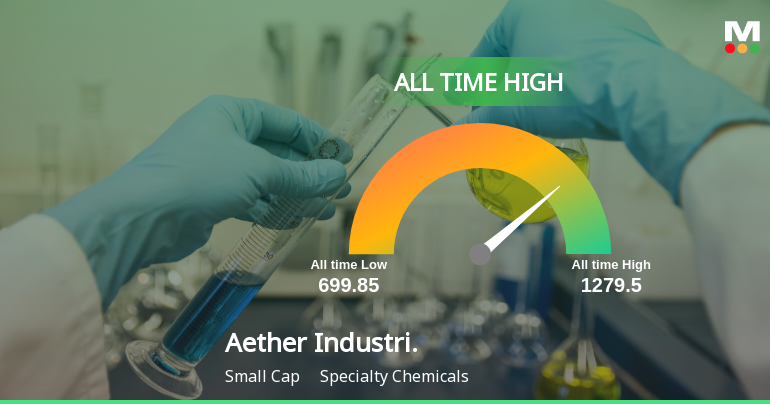
Aether Industries Ltd Hits All-Time High of Rs 1,279.5 as Momentum Builds Across Timeframes
Extending its winning streak to four consecutive sessions, Aether Industries Ltd surged to a fresh all-time high of Rs 1,279.5 on 24 Jun 2026, outperforming its sector and the broader market with a 1.52% gain on the day.
Read full news article Announcements
Announcement under Regulation 30 (LODR)-Allotment of ESOP / ESPS
15-Jun-2026 | Source : BSEIn accordance with Reg. 30 of the SEBI (Listing Obligations and Disclosure Requirements) regulations 2015 we herewith inform about allotment of 3677 shares under AIL ESOS 2021 as annexed.
Receipt Of The Final Claim Amount Of Insurance
06-Jun-2026 | Source : BSEIn accordance with Reg. 30 of the SEBI (Listing Obligations and Disclosure Requirements) Regulations 2015 we herewith inform about the receipt of amount of final settlement claim of insurance as annexed.
Announcement under Regulation 30 (LODR)-Credit Rating
26-May-2026 | Source : BSEIn accordance with Reg. 30 of the SEBI (Listing Obligations and Disclosure Requirements) Regulations 2015 we herewith submit the Credit rating as annexed.
Corporate Actions

No Upcoming Board Meetings

No Dividend history available

No Splits history available

No Bonus history available

No Rights history available
Quality key factors
Valuation key factors
Technicals key factors
 Technical Indicator Scale: Bearish, Mildly Bearish, Sideways, Mildly Bullish, Bullish Turned
 Shareholding Snapshot : Mar 2026
Shareholding Compare (%holding)
Promoters
None
Held by 15 Schemes (11.58%)
Held by 84 FIIs (6.29%)
Purnima Ashwin Desai (17.4%)
Sbi Multicap Fund (8.63%)
4.88%
Quarterly Results Snapshot (Consolidated) - Mar'26 - QoQ

QoQ Growth in quarter ended Mar 2026 is -4.29% vs 13.81% in Dec 2025
QoQ Growth in quarter ended Mar 2026 is -16.24% vs 19.50% in Dec 2025
Half Yearly Results Snapshot (Consolidated) - Sep'25

Growth in half year ended Sep 2025 is 40.24% vs 16.46% in Sep 2024
Growth in half year ended Sep 2025 is 56.00% vs -2.65% in Sep 2024
Nine Monthly Results Snapshot (Consolidated) - Dec'25
YoY Growth in nine months ended Dec 2025 is 42.03% vs 24.52% in Dec 2024
YoY Growth in nine months ended Dec 2025 is 53.03% vs 28.84% in Dec 2024
Annual Results Snapshot (Consolidated) - Mar'26
YoY Growth in year ended Mar 2026 is 38.33% vs 40.21% in Mar 2025
YoY Growth in year ended Mar 2026 is 38.53% vs 92.05% in Mar 2025
About Aether Industries Ltd

Company Coordinates


