
Compare Afcons Infrastr. with Similar Stocks
Dashboard
Weak Long Term Fundamental Strength with a -1.80% CAGR growth in Operating Profits over the last 5 years
- Company's ability to service its debt is weak with a poor EBIT to Interest (avg) ratio of 1.25
- The company has been able to generate a Return on Equity (avg) of 7.49% signifying low profitability per unit of shareholders funds
With a fall in Net Sales of -12.16%, the company declared Very Negative results in Mar 26
60.13% of Promoter Shares are Pledged
Below par performance in long term as well as near term
Stock DNA
Construction
INR 11,129 Cr (Small Cap)
34.00
44
0.00%
0.50
5.72%
1.93
Total Returns (Price + Dividend) 
Afcons Infrastr. for the last several years.
Risk Adjusted Returns v/s
Returns Beta

News
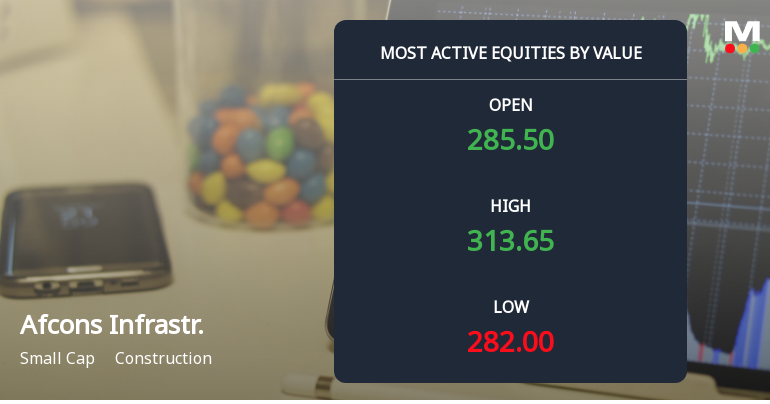
Afcons Infrastructure Ltd Sees Surge in Value Trading Amid Strong Sell Rating
Afcons Infrastructure Ltd, a small-cap player in the construction sector, witnessed significant trading activity on 17 Jul 2026, with its shares recording a robust 5.6% gain and emerging as one of the highest value stocks traded on the day. Despite this intraday strength, the stock remains under pressure from a strong sell rating and technical resistance at longer-term moving averages, signalling a complex outlook for investors.
Read full news article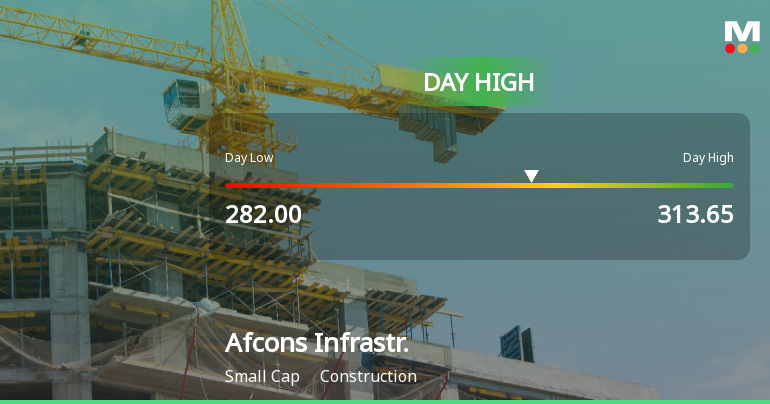
Afcons Infrastructure Ltd Surges 9.12% to Day's High of Rs 311.1 — Outperforms Sector by 9.18 Percentage Points
The Sensex advanced 0.77% on 17 Jul 2026, yet Afcons Infrastructure Ltd outpaced the broader market with a 9.12% gain, touching an intraday high of Rs 311.1. This 9.18-percentage-point outperformance over its Construction sector peers highlights a distinctly stock-specific rally rather than a market-wide lift.
Read full news article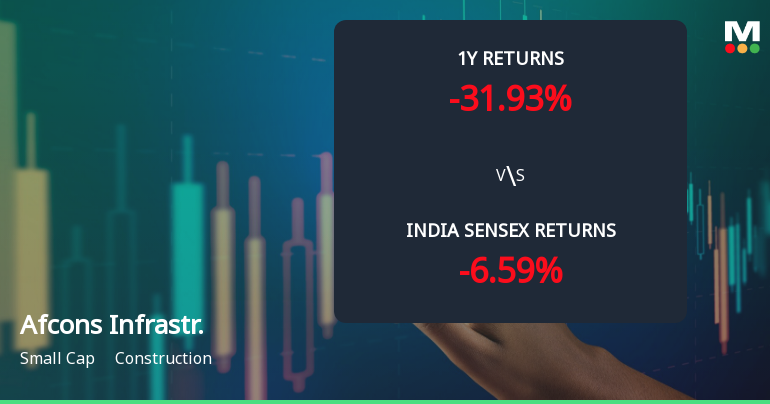
Afcons Infrastructure Ltd Faces Intensified Bearish Momentum Amid Technical Downgrade
Afcons Infrastructure Ltd, a small-cap player in the construction sector, has seen a marked deterioration in its technical indicators, signalling a shift towards bearish momentum. The stock’s recent price action and technical parameters suggest increasing downside risks amid broader market challenges and sectoral pressures.
Read full news article Announcements
Compliances-Certificate under Reg. 74 (5) of SEBI (DP) Regulations 2018
14-Jul-2026 | Source : BSECompliance in terms of Reg. 74 (5) SEBI (Depositories and Participant) Regulations 2018 for the Quarter ended June 30 2026
Communication To Shareholders - Dividend For FY 2025-26 - Intimation On Tax Deduction At Source (TDS) / Withholding Tax On Dividend
14-Jul-2026 | Source : BSEPlease find enclosed intimation on Tax Deduction at source (TDS)/ Withholding Tax on Divided sent to shareholders
Announcement under Regulation 30 (LODR)-Newspaper Publication
09-Jul-2026 | Source : BSEPlease find enclosed copies of Newspaper Advertisement regrading 50th Annual General Meeting and E-Voting related Information
Corporate Actions

No Upcoming Board Meetings

Afcons Infrastructure Ltd has declared 20% dividend, ex-date: 23 Jul 26

No Splits history available

No Bonus history available

No Rights history available
Quality key factors
Valuation key factors
Technicals key factors
 Technical Indicator Scale: Bearish, Mildly Bearish, Sideways, Mildly Bullish, Bullish Turned
 Shareholding Snapshot : Mar 2026
Shareholding Compare (%holding)
Promoters
60.1292
Held by 25 Schemes (18.6%)
Held by 83 FIIs (12.19%)
Goswami Infratech Private Limited (25.03%)
Sbi Small Cap Fund (4.85%)
6.61%
Quarterly Results Snapshot (Consolidated) - Mar'26 - QoQ

QoQ Growth in quarter ended Mar 2026 is -12.16% vs -0.42% in Dec 2025
QoQ Growth in quarter ended Mar 2026 is -191.05% vs -7.89% in Dec 2025
Half Yearly Results Snapshot (Consolidated) - Sep'25

Growth in half year ended Sep 2025 is 4.00% vs -6.02% in Sep 2024
Growth in half year ended Sep 2025 is 6.81% vs 16.33% in Sep 2024
Nine Monthly Results Snapshot (Consolidated) - Dec'25
YoY Growth in nine months ended Dec 2025 is 0.10% vs -3.18% in Dec 2024
YoY Growth in nine months ended Dec 2025 is -9.66% vs 23.29% in Dec 2024
Annual Results Snapshot (Consolidated) - Mar'26
YoY Growth in year ended Mar 2026 is -4.78% vs -5.42% in Mar 2025
YoY Growth in year ended Mar 2026 is -48.34% vs 8.24% in Mar 2025
About Afcons Infrastructure Ltd

Company Coordinates


