
Compare Affle 3i with Similar Stocks
Dashboard
With ROE of 12.5, it has a Very Expensive valuation with a 5.7 Price to Book Value
- The stock is trading at a fair value compared to its peers' average historical valuations
- Over the past year, while the stock has generated a return of -23.55%, its profits have risen by 19.1% ; the PEG ratio of the company is 2.4
Underperformed the market in the last 1 year
Stock DNA
Computers - Software & Consulting
INR 20,444 Cr (Small Cap)
46.00
22
0.00%
-0.35
12.45%
5.70
Total Returns (Price + Dividend) 
Affle 3i for the last several years.
Risk Adjusted Returns v/s
Returns Beta

News

Affle 3i Ltd is Rated Sell
Affle 3i Ltd is rated Sell by MarketsMOJO, with this rating last updated on 18 May 2026. However, the analysis and financial metrics presented here reflect the stock’s current position as of 21 June 2026, providing investors with an up-to-date view of the company’s fundamentals, valuation, financial trends, and technical outlook.
Read full news article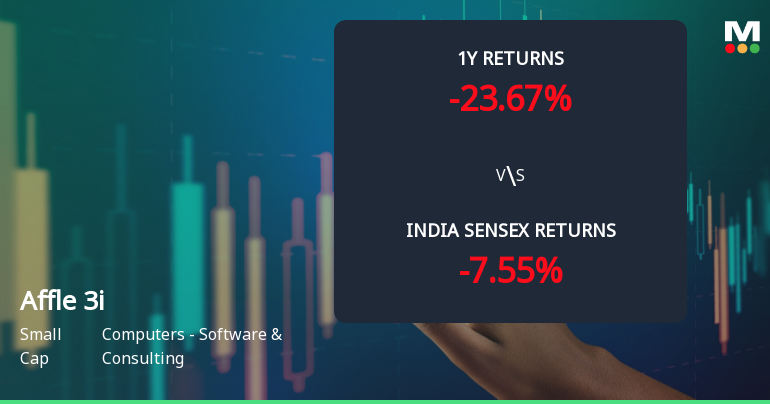
Affle 3i Ltd Technical Momentum Shifts Amid Mixed Market Signals
Affle 3i Ltd, a small-cap player in the Computers - Software & Consulting sector, has experienced a nuanced shift in its technical momentum, reflecting a complex interplay of bullish and bearish signals. Despite a modest day gain of 0.68%, the stock’s broader technical indicators reveal a transition from bearish to mildly bearish trends, prompting a downgrade in its Mojo Grade from Hold to Sell as of 18 May 2026.
Read full news article
Affle 3i Ltd Faces Bearish Momentum Amid Technical Downgrade
Affle 3i Ltd, a small-cap player in the Computers - Software & Consulting sector, has experienced a notable shift in its technical momentum, with key indicators signalling a transition from mildly bearish to bearish trends. The stock’s recent performance, combined with mixed technical signals, suggests increased caution for investors amid a challenging market backdrop.
Read full news article Announcements
Disclosures under Reg. 29(2) of SEBI (SAST) Regulations 2011
19-Jun-2026 | Source : BSEThe Exchange has received the disclosure under Regulation 29(2) of SEBI (Substantial Acquisition of Shares & Takeovers) Regulations 2011 for Affle Holdings Pte Ltd
Announcement under Regulation 30 (LODR)-Analyst / Investor Meet - Intimation
19-Jun-2026 | Source : BSEUnder Regulation 30 of the SEBI (Listing Obligations and Disclosure Requirements) Regulations 2015 submitting the Analyst and Investor meetings schedule. The notification letter is as attached.
Announcement under Regulation 30 (LODR)-Allotment
18-Jun-2026 | Source : BSEAllotment of warrants to Affle Holdings Pte. Ltd.
Corporate Actions

No Upcoming Board Meetings

No Dividend history available

Affle 3i Ltd has announced 2:10 stock split, ex-date: 07 Oct 21

No Bonus history available

No Rights history available
Quality key factors
Valuation key factors
Technicals key factors
 Technical Indicator Scale: Bearish, Mildly Bearish, Sideways, Mildly Bullish, Bullish Turned
 Shareholding Snapshot : Mar 2026
Shareholding Compare (%holding)
Promoters
None
Held by 31 Schemes (13.71%)
Held by 151 FIIs (16.66%)
Affle Holdings Pte Ltd (40.65%)
Gamnat Pte. Ltd. (4.9%)
7.07%
Quarterly Results Snapshot (Consolidated) - Mar'26 - QoQ

QoQ Growth in quarter ended Mar 2026 is 0.96% vs 10.94% in Dec 2025
QoQ Growth in quarter ended Mar 2026 is 0.16% vs 7.97% in Dec 2025
Half Yearly Results Snapshot (Consolidated) - Sep'25
Growth in half year ended Sep 2025 is 19.30% vs 26.79% in Sep 2024
Growth in half year ended Sep 2025 is 20.96% vs 34.31% in Sep 2024
Nine Monthly Results Snapshot (Consolidated) - Dec'25
YoY Growth in nine months ended Dec 2025 is 19.28% vs 24.50% in Dec 2024
YoY Growth in nine months ended Dec 2025 is 20.28% vs 32.90% in Dec 2024
Annual Results Snapshot (Consolidated) - Mar'26
YoY Growth in year ended Mar 2026 is 19.55% vs 22.98% in Mar 2025
YoY Growth in year ended Mar 2026 is 19.11% vs 28.46% in Mar 2025
About Affle 3i Ltd

Company Coordinates


