
Compare Affle 3i with Similar Stocks
Stock DNA
Computers - Software & Consulting
INR 22,520 Cr (Small Cap)
50.00
20
0.00%
-0.35
12.45%
6.26
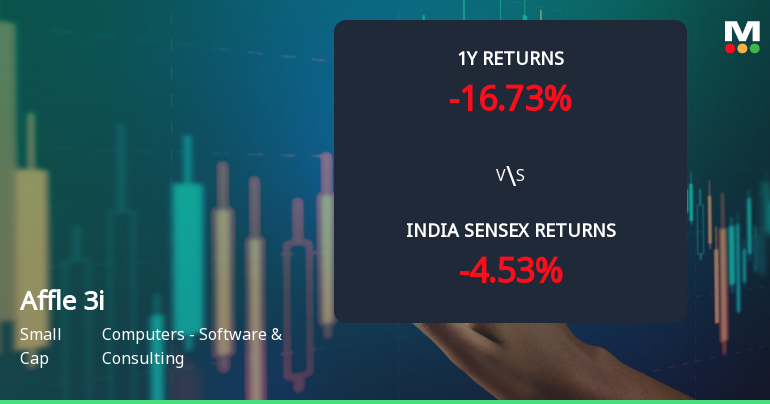
Total Returns (Price + Dividend) 
Affle 3i for the last several years.
Risk Adjusted Returns v/s
Returns Beta

News
Affle 3i Ltd Technical Momentum Shifts Amid Mixed Market Signals
Affle 3i Ltd, a small-cap player in the Computers - Software & Consulting sector, has experienced a notable shift in its technical momentum, moving from a mildly bearish stance to a sideways trend. Despite a recent upgrade in price action, the company’s technical indicators present a mixed picture, reflecting both bullish and bearish signals across weekly and monthly timeframes. This analysis delves into the latest technical parameters, price momentum, and comparative market performance to provide investors with a comprehensive view of Affle 3i’s current positioning.
Read full news article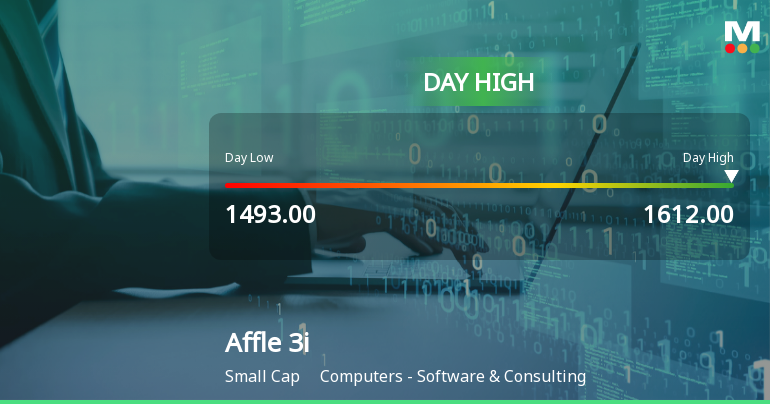
Affle 3i Ltd Surges 7.63% to Day's High of Rs 1598.4 — Outperforms Sector by 7.98 Percentage Points
The Sensex edged up a modest 0.07% on 28 Jul 2026, while Affle 3i Ltd surged 7.63%, outperforming its sector by nearly 8 percentage points. This sharp single-session gain stands out as a clear stock-specific event rather than a market-wide rally, signalling renewed strength in the small-cap software and consulting firm.
Read full news article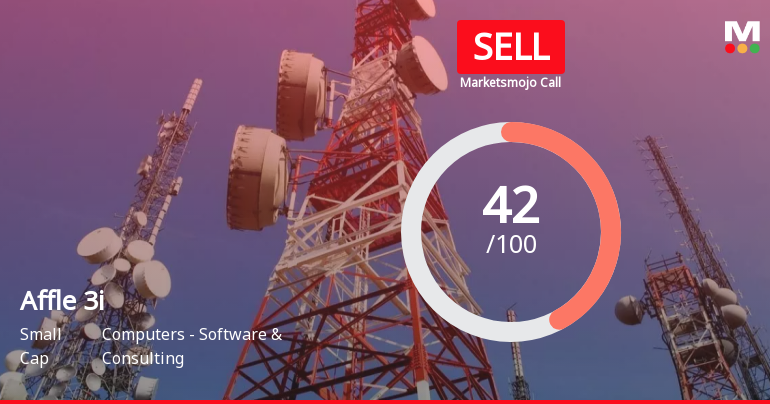
Affle 3i Ltd is Rated Sell by MarketsMOJO
Affle 3i Ltd is rated 'Sell' by MarketsMOJO, with this rating last updated on 18 May 2026. However, the analysis and financial metrics discussed here reflect the stock's current position as of 24 July 2026, providing investors with an up-to-date view of the company’s fundamentals, valuation, financial trends, and technical outlook.
Read full news article Announcements
Affle (India) Limited - Press Release
05-Dec-2019 | Source : NSEAffle (India) Limited has informed the Exchange regarding a press release dated December 05, 2019, titled "Affle launches Vizury Engage360 to simplify omnichannel marketing".
Affle (India) Limited - Press Release
26-Nov-2019 | Source : NSEAffle (India) Limited has informed the Exchange regarding a press release dated November 26, 2019, titled "Affle gets recognized as a Great Place to Work ".
Affle (India) Limited - Investor Presentation
15-Nov-2019 | Source : NSEAffle (India) Limited has informed the Exchange regarding Investor Presentation
Corporate Actions

No Upcoming Board Meetings

No Dividend history available

Affle 3i Ltd has announced 2:10 stock split, ex-date: 07 Oct 21

No Bonus history available

No Rights history available
Quality key factors
Valuation key factors
Technicals key factors
 Technical Indicator Scale: Bearish, Mildly Bearish, Sideways, Mildly Bullish, Bullish Turned
 Shareholding Snapshot : Jun 2026
Shareholding Compare (%holding)
Promoters
99.9998
Held by 30 Schemes (15.26%)
Held by 139 FIIs (15.38%)
Affle Holdings Pte Ltd (40.65%)
Gamnat Pte. Ltd. (4.9%)
7.49%
Quarterly Results Snapshot (Consolidated) - Mar'26 - QoQ

QoQ Growth in quarter ended Mar 2026 is 0.96% vs 10.94% in Dec 2025
QoQ Growth in quarter ended Mar 2026 is 0.16% vs 7.97% in Dec 2025
Half Yearly Results Snapshot (Consolidated) - Sep'25
Growth in half year ended Sep 2025 is 19.30% vs 26.79% in Sep 2024
Growth in half year ended Sep 2025 is 20.96% vs 34.31% in Sep 2024
Nine Monthly Results Snapshot (Consolidated) - Dec'25
YoY Growth in nine months ended Dec 2025 is 19.28% vs 24.50% in Dec 2024
YoY Growth in nine months ended Dec 2025 is 20.28% vs 32.90% in Dec 2024
Annual Results Snapshot (Consolidated) - Mar'26
YoY Growth in year ended Mar 2026 is 19.55% vs 22.98% in Mar 2025
YoY Growth in year ended Mar 2026 is 19.11% vs 28.46% in Mar 2025
About Affle 3i Ltd

Company Coordinates


