
Compare Akash InfraProj. with Similar Stocks
Dashboard
Weak Long Term Fundamental Strength with an average Return on Capital Employed (ROCE) of 2.26%
- Poor long term growth as Net Sales has grown by an annual rate of 4.04% and Operating profit at 14.14% over the last 5 years
- Low ability to service debt as the company has a high Debt to EBITDA ratio of 13.64 times
Flat results in Mar 26
Below par performance in long term as well as near term
Total Returns (Price + Dividend) 
Latest dividend: 0.1 per share ex-dividend date: Sep-15-2022
Risk Adjusted Returns v/s
Returns Beta

News

Akash Infraprojects Ltd is Rated Sell
Akash Infraprojects Ltd is rated 'Sell' by MarketsMOJO, with this rating last updated on 11 May 2026. However, the analysis and financial metrics presented here reflect the stock's current position as of 04 June 2026, providing investors with the latest insights into its performance and outlook.
Read full news article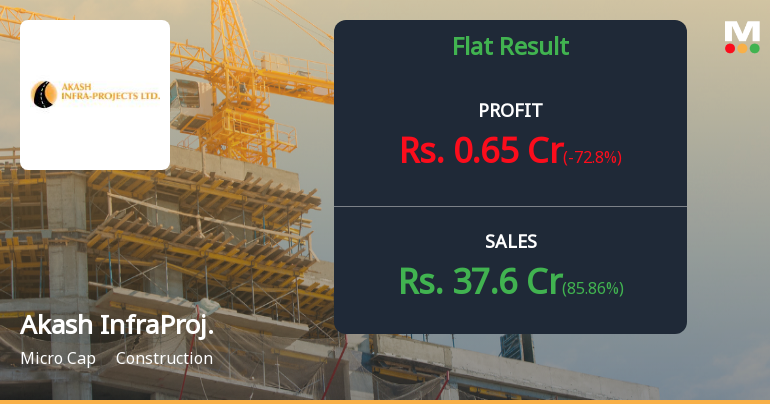
Akash Infraprojects Q4 FY26: Revenue Surge Masks Profitability Concerns
Akash Infraprojects Ltd., a micro-cap construction company with a market capitalisation of ₹46.00 crores, reported a dramatic revenue surge in Q4 FY26, but the headline numbers mask persistent profitability challenges that continue to weigh on the company's financial performance. Net profit for the quarter stood at ₹0.65 crores, down 28.57% quarter-on-quarter and a steep 72.80% year-on-year, even as net sales more than doubled to ₹37.60 crores.
Read full news article
Akash Infraprojects Ltd is Rated Sell
Akash Infraprojects Ltd is rated 'Sell' by MarketsMOJO, with this rating last updated on 11 May 2026. However, the analysis and financial metrics discussed here reflect the stock's current position as of 20 May 2026, providing investors with the most recent and relevant data to inform their decisions.
Read full news article Announcements
Akash Infra Projects Limited - Updates
09-Dec-2019 | Source : NSEAkash Infra Projects Limited has informed the Exchange regarding 'Receipt of Work Order.'.
Akash Infra Projects Limited - Outcome of Board Meeting
15-Nov-2019 | Source : NSEAkash Infra Projects Limited has informed the Exchange regarding Board meeting held on November 14, 2019.
Corporate Actions

No Upcoming Board Meetings

Akash Infraprojects Ltd has declared 1% dividend, ex-date: 15 Sep 22

No Splits history available

Akash Infraprojects Ltd has announced 1:1 bonus issue, ex-date: 07 Mar 19

No Rights history available
Quality key factors
Valuation key factors
Technicals key factors
 Technical Indicator Scale: Bearish, Mildly Bearish, Sideways, Mildly Bullish, Bullish Turned
 Shareholding Snapshot : Mar 2026
Shareholding Compare (%holding)
Promoters
None
Held by 0 Schemes
Held by 0 FIIs
Ambusinh P Gol (23.25%)
Rajeswara Rao Yanamadala (1.91%)
23.06%
Quarterly Results Snapshot (Consolidated) - Mar'26 - YoY

YoY Growth in quarter ended Mar 2026 is 85.86% vs 32.83% in Mar 2025

YoY Growth in quarter ended Mar 2026 is -72.80% vs -23.89% in Mar 2025
Half Yearly Results Snapshot (Consolidated) - Sep'25
Growth in half year ended Sep 2025 is 39.26% vs -38.76% in Sep 2024
Growth in half year ended Sep 2025 is 41.67% vs -102.60% in Sep 2024
Nine Monthly Results Snapshot (Consolidated) - Dec'25
YoY Growth in nine months ended Dec 2025 is 16.92% vs -14.74% in Dec 2024
YoY Growth in nine months ended Dec 2025 is 100.00% vs 48.45% in Dec 2024
Annual Results Snapshot (Consolidated) - Mar'26
YoY Growth in year ended Mar 2026 is 40.97% vs -2.55% in Mar 2025
YoY Growth in year ended Mar 2026 is -26.97% vs 286.96% in Mar 2025
About Akash Infraprojects Ltd

Company Coordinates


