
Compare A.K.Capital Serv with Similar Stocks
Dashboard
Weak Long Term Fundamental Strength with an average Return on Equity (ROE) of 10.10%
The company has declared Positive results for the last 3 consecutive quarters
With ROE of 10.5, it has a Attractive valuation with a 1.1 Price to Book Value
Despite the size of the company, domestic mutual funds hold only 0% of the company
Market Beating performance in long term as well as near term
Stock DNA
Non Banking Financial Company (NBFC)
INR 1,198 Cr (Micro Cap)
11.00
21
2.94%
2.95
10.55%
1.12
Total Returns (Price + Dividend) 
Latest dividend: 22.066956521739133 per share ex-dividend date: Feb-24-2026
Risk Adjusted Returns v/s
Returns Beta

News
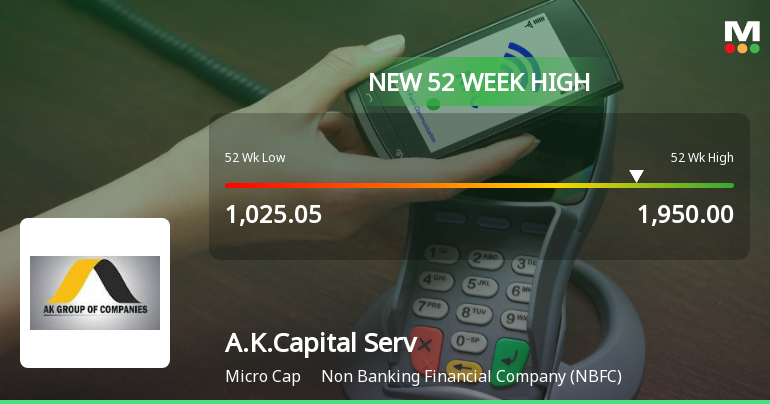
Broad-Based Technical Strength Lifts A.K.Capital Services Ltd to 52-Week High of Rs 1950
Surging to an all-time high of Rs 1950 on 22 Jun 2026, A.K.Capital Services Ltd has demonstrated remarkable price momentum, outperforming its sector and the broader market with a 70.95% gain over the past year against the Sensex's 6.40% decline.
Read full news article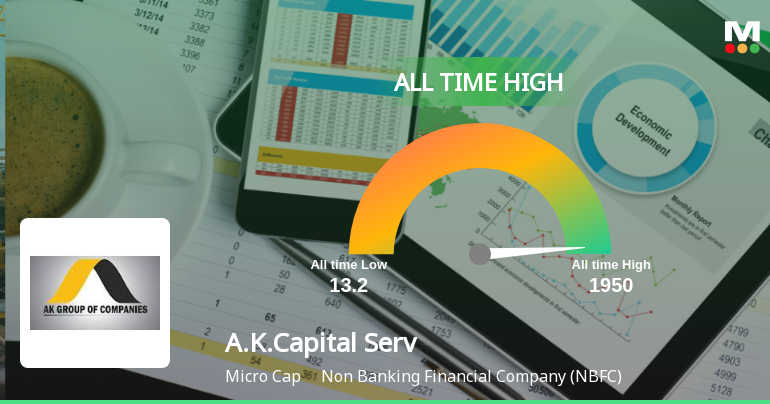
A.K.Capital Services Ltd Hits All-Time High of Rs 1,950 as Momentum Builds Across Timeframes
After opening with a sharp 12.29% gap up, A.K.Capital Services Ltd surged to touch a fresh all-time high of Rs 1,950 on 22 Jun 2026, extending its recent winning streak and outperforming the broader Sensex by a wide margin.
Read full news article
A.K.Capital Services Ltd is Rated Hold
A.K.Capital Services Ltd is rated 'Hold' by MarketsMOJO, with this rating last updated on 25 May 2026. However, the analysis and financial metrics presented here reflect the stock's current position as of 17 June 2026, providing investors with the most recent insights into the company’s performance and outlook.
Read full news article Announcements
Compliances-Reg.24(A)-Annual Secretarial Compliance
29-May-2026 | Source : BSEAnnual Secretarial Compliance Report for the financial year ended March 31 2026.
Fixation Of Book Closure For The Purpose Of Final Dividend Subject To Approval Of Shareholders At The Ensuing Annual General Meeting
20-May-2026 | Source : BSEFixation of Book Closure for the purpose of final dividend subject to approval of shareholders at the ensuing Annual General Meeting
Board Meeting Outcome for Outcome Of The Board Meeting Held On Wednesday May 20 2026
20-May-2026 | Source : BSEOutcome of the Board Meeting held on Wednesday May 20 2026.
Corporate Actions

No Upcoming Board Meetings

A.K.Capital Services Ltd has declared 220% dividend, ex-date: 24 Feb 26

No Splits history available

No Bonus history available

No Rights history available
Quality key factors
Valuation key factors
Technicals key factors
 Technical Indicator Scale: Bearish, Mildly Bearish, Sideways, Mildly Bullish, Bullish Turned
 Shareholding Snapshot : Mar 2026
Shareholding Compare (%holding)
Promoters
None
Held by 0 Schemes
Held by 0 FIIs
Family Home Consultancy Services Private Limited (49.39%)
A.m. Credit Analysis And Research Llp (4.92%)
18.59%
Quarterly Results Snapshot (Consolidated) - Mar'26 - QoQ

QoQ Growth in quarter ended Mar 2026 is 10.26% vs -12.55% in Dec 2025
QoQ Growth in quarter ended Mar 2026 is 28.25% vs -16.93% in Dec 2025
Half Yearly Results Snapshot (Consolidated) - Sep'25
Growth in half year ended Sep 2025 is 22.74% vs -2.31% in Sep 2024
Growth in half year ended Sep 2025 is 25.10% vs 1.45% in Sep 2024
Nine Monthly Results Snapshot (Consolidated) - Dec'25
YoY Growth in nine months ended Dec 2025 is 20.91% vs -6.01% in Dec 2024
YoY Growth in nine months ended Dec 2025 is 32.53% vs -4.37% in Dec 2024
Annual Results Snapshot (Consolidated) - Mar'26
YoY Growth in year ended Mar 2026 is 18.80% vs -7.16% in Mar 2025
YoY Growth in year ended Mar 2026 is 30.24% vs -7.61% in Mar 2025
About A.K.Capital Services Ltd

Company Coordinates


