
Compare Akums Drugs with Similar Stocks
Dashboard
The company is Net-Debt Free
Poor long term growth as Net Sales has grown by an annual rate of 6.00% and Operating profit at 17.74% over the last 5 years
Flat results in Mar 26
With ROE of 8.1, it has a Very Attractive valuation with a 3 Price to Book Value
Majority shareholders : Promoters
Market Beating Performance
Stock DNA
Pharmaceuticals & Biotechnology
INR 10,227 Cr (Small Cap)
37.00
36
0.48%
-0.46
8.11%
2.96
Total Returns (Price + Dividend) 
Latest dividend: 1.0026960784313725 per share ex-dividend date: Jul-03-2026
Risk Adjusted Returns v/s
Returns Beta

News
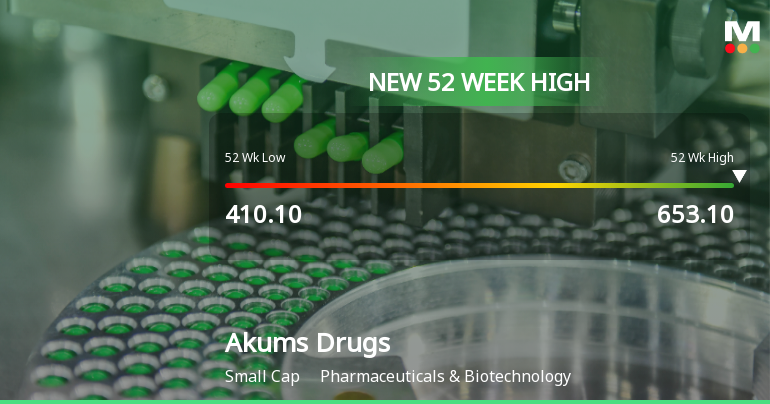
Broad-Based Technical Strength Lifts Akums Drugs & Pharmaceuticals Ltd to 52-Week High of Rs 653.1
With a decisive surge to Rs 653.1 on 7 Jul 2026, Akums Drugs & Pharmaceuticals Ltd has reached a fresh 52-week high, marking a significant milestone in its price momentum. This advance comes amid a backdrop of sustained technical strength and a market environment that has broadly supported small-cap gains.
Read full news article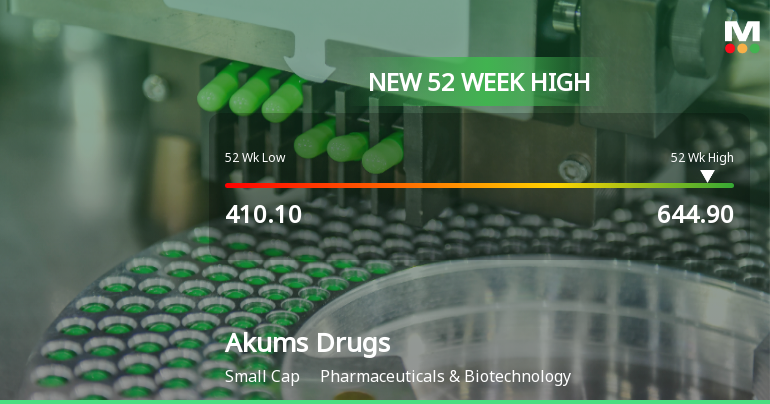
Broad-Based Technical Strength Lifts Akums Drugs & Pharmaceuticals Ltd to 52-Week High of Rs 644.9
With a decisive break above Rs 644.9 on 3 Jul 2026, Akums Drugs & Pharmaceuticals Ltd has reached a fresh 52-week high, marking a significant milestone in its price momentum. This advance comes amid a backdrop of broad technical alignment and a market environment where the pharmaceutical sector indices are also hitting new peaks.
Read full news article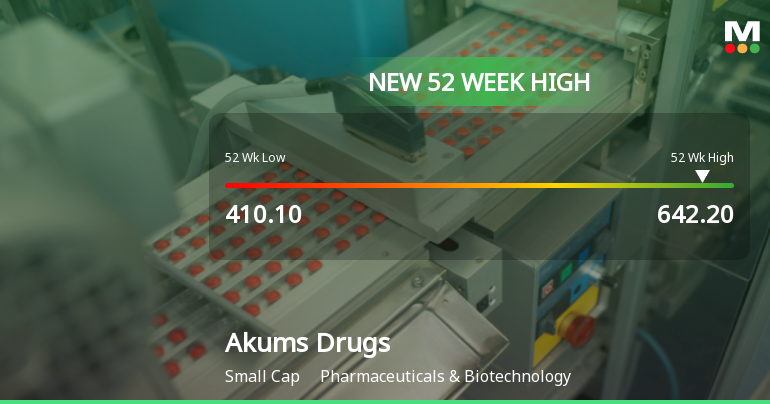
Broad-Based Technical Strength Lifts Akums Drugs & Pharmaceuticals Ltd to 52-Week High of Rs 642.2
Surging past its previous peak, Akums Drugs & Pharmaceuticals Ltd touched a fresh 52-week high of Rs 642.2 on 30 Jun 2026, marking a notable milestone in its price momentum. This advance comes amid a backdrop of strong technical signals and sustained upward movement across multiple timeframes.
Read full news article Announcements
Update On Penalty Imposed By The Deputy Commissioner Of State Tax Gujarat On Maxcure Nutravedics Limited Wholly Owned Subsidiary Of The Company
04-Jul-2026 | Source : BSEUpdate on penalty imposed by the Deputy Commissioner of State Tax Gujarat on Maxcure Nutravedics Limited wholly owned subsidiary of the Company
Closure of Trading Window
25-Jun-2026 | Source : BSEClosure of Trading Window
Announcement under Regulation 30 (LODR)-Newspaper Publication
19-Jun-2026 | Source : BSENewspaper Advertisements of the 22nd Annual General Meeting of the Company
Corporate Actions

No Upcoming Board Meetings

Akums Drugs & Pharmaceuticals Ltd has declared 50% dividend, ex-date: 03 Jul 26

No Splits history available

No Bonus history available

No Rights history available
Quality key factors
Valuation key factors
Technicals key factors
 Technical Indicator Scale: Bearish, Mildly Bearish, Sideways, Mildly Bullish, Bullish Turned
 Shareholding Snapshot : Mar 2026
Shareholding Compare (%holding)
Promoters
None
Held by 9 Schemes (10.95%)
Held by 21 FIIs (1.37%)
Akums Master Trust (sanjeev Jain And Sandeep Jain) (40.79%)
Icici Prudential Pharma Healthcare And Diaganostics (p.h.d) Fund (4.56%)
5.34%
Quarterly Results Snapshot (Consolidated) - Mar'26 - QoQ

QoQ Growth in quarter ended Mar 2026 is -0.15% vs 13.96% in Dec 2025
QoQ Growth in quarter ended Mar 2026 is 27.58% vs 62.63% in Dec 2025
Half Yearly Results Snapshot (Consolidated) - Sep'25

Growth in half year ended Sep 2025 is -0.52% vs -4.60% in Sep 2024
Growth in half year ended Sep 2025 is -16.84% vs 180.16% in Sep 2024
Nine Monthly Results Snapshot (Consolidated) - Dec'25
YoY Growth in nine months ended Dec 2025 is 4.52% vs -5.30% in Dec 2024
YoY Growth in nine months ended Dec 2025 is -10.48% vs 411.16% in Dec 2024
Annual Results Snapshot (Consolidated) - Mar'26
YoY Growth in year ended Mar 2026 is 5.85% vs -1.44% in Mar 2025
YoY Growth in year ended Mar 2026 is -24.54% vs 8,470.79% in Mar 2025
About Akums Drugs & Pharmaceuticals Ltd

Company Coordinates


