
Compare Sudeep Pharma with Similar Stocks
Dashboard
High Management Efficiency with a high ROE of 0%
Strong ability to service debt as the company has a low Debt to EBITDA ratio of 0.68 times
Poor long term growth as Operating profit has grown by an annual rate 0% of over the last 5 years
Positive results in Mar 26
With ROE of 19.6, it has a Very Expensive valuation with a 11 Price to Book Value
Majority shareholders : Promoters
Stock DNA
Pharmaceuticals & Biotechnology
INR 9,894 Cr (Small Cap)
56.00
36
0.00%
0.04
19.57%
11.30
Total Returns (Price + Dividend) 
Sudeep Pharma for the last several years.
Risk Adjusted Returns v/s
Returns Beta

News

Sudeep Pharma Ltd is Rated Hold by MarketsMOJO
Sudeep Pharma Ltd is rated 'Hold' by MarketsMOJO, with this rating last updated on 22 May 2026. However, the analysis and financial metrics discussed here reflect the stock's current position as of 11 July 2026, providing investors with an up-to-date view of the company’s fundamentals, valuation, financial trends, and technical outlook.
Read full news article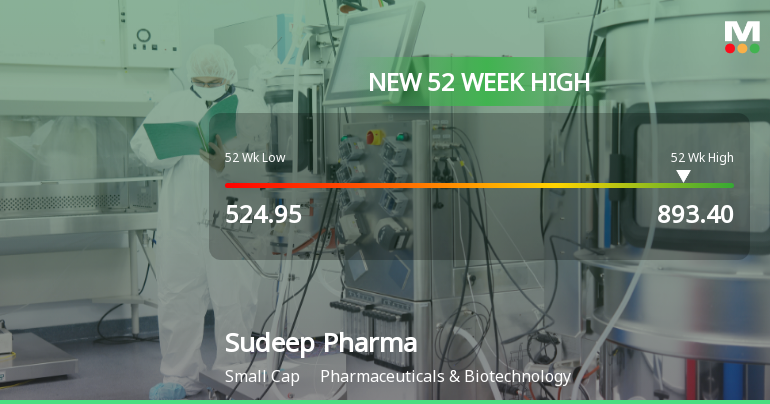
Broad-Based Technical Strength Lifts Sudeep Pharma Ltd to 52-Week High of Rs 893.4
With every major technical indicator aligned to the upside, Sudeep Pharma Ltd surged to a fresh 52-week high of Rs 893.4 on 6 Jul 2026, marking a significant milestone in its price momentum despite a slight pullback on the day.
Read full news article
Sudeep Pharma Ltd Technical Momentum Shifts Signal Mild Bullish Outlook
Sudeep Pharma Ltd, a small-cap player in the Pharmaceuticals & Biotechnology sector, has exhibited a notable shift in its technical momentum, transitioning from a sideways trend to a mildly bullish stance. This change is underscored by a combination of technical indicators including MACD, RSI, Bollinger Bands, and moving averages, signalling a potential uptrend in the stock’s price trajectory.
Read full news article Announcements
Announcement under Regulation 30 (LODR)-Newspaper Publication
11-Jul-2026 | Source : BSESubmission of Newspaper Advertisement for 37th AGM E-voting and dividend information published in Business Standard (English) and Vadodara Samachar (regional language) on Saturday 11th July 2026.
Intimation Of Record Date For Payment Of Final Dividend On Equity Shares For The Financial Year 2025-26
10-Jul-2026 | Source : BSERecord date for payment of final dividend on equity shares for the FY 2025-26 is Thursday 23rd July 2026.
Compliances-Certificate under Reg. 74 (5) of SEBI (DP) Regulations 2018
10-Jul-2026 | Source : BSESubmission of Certificate under Regulation 74 (5) of SEBI (DP) Regulations for the Quarter ended 30.06.2026
Corporate Actions

No Upcoming Board Meetings

Sudeep Pharma Ltd has declared 150% dividend, ex-date: 23 Jul 26

No Splits history available

No Bonus history available

No Rights history available
Quality key factors
Valuation key factors
Technicals key factors
 Technical Indicator Scale: Bearish, Mildly Bearish, Sideways, Mildly Bullish, Bullish Turned
 Shareholding Snapshot : Jun 2026
Shareholding Compare (%holding)
Promoters
None
Held by 14 Schemes (5.47%)
Held by 17 FIIs (1.81%)
Riva Resources Private Limited (40.35%)
Nuvama Crossover Opportunities Fund - Series Iii (2.95%)
4.89%
Quarterly Results Snapshot (Standalone) - Mar'26 - QoQ

QoQ Growth in quarter ended Mar 2026 is -11.20% vs 2.73% in Dec 2025

QoQ Growth in quarter ended Mar 2026 is -4.09% vs -9.65% in Dec 2025
Half Yearly Results Snapshot (Standalone) - Sep'25
Not Applicable: The company has declared_date for only one period
Not Applicable: The company has declared_date for only one period
Nine Monthly Results Snapshot (Standalone) - Dec'25
Not Applicable: The company has declared_date for only one period
Not Applicable: The company has declared_date for only one period
Annual Results Snapshot (Consolidated) - Mar'26
YoY Growth in year ended Mar 2026 is 27.94% vs 9.30% in Mar 2025
YoY Growth in year ended Mar 2026 is 24.62% vs 4.16% in Mar 2025
About Sudeep Pharma Ltd

Company Coordinates


