
Compare Alicon Cast. with Similar Stocks
Stock DNA
Auto Components & Equipments
INR 1,049 Cr (Micro Cap)
26.00
35
0.76%
0.53
6.25%
1.71
Total Returns (Price + Dividend) 
Latest dividend: 2 per share ex-dividend date: May-19-2026
Risk Adjusted Returns v/s
Returns Beta

News
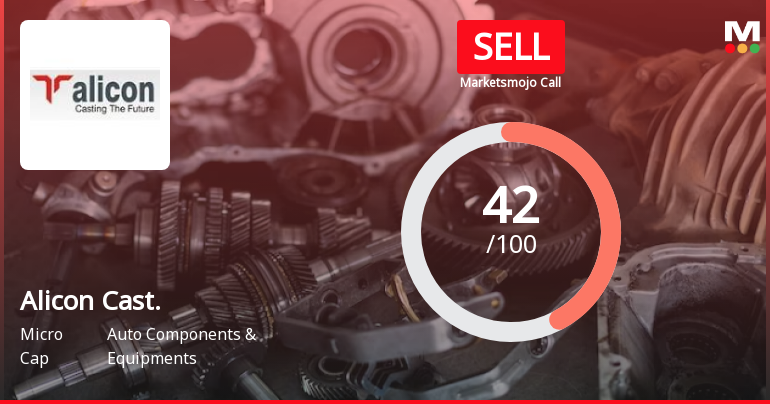
Alicon Castalloy Ltd is Rated Sell
Alicon Castalloy Ltd is rated 'Sell' by MarketsMOJO, with this rating last updated on 13 May 2026. However, the analysis and financial metrics discussed here reflect the stock's current position as of 08 June 2026, providing investors with the latest insights into its performance and outlook.
Read full news article
Alicon Castalloy Ltd is Rated Sell
Alicon Castalloy Ltd is rated 'Sell' by MarketsMOJO, with this rating last updated on 13 May 2026. However, the analysis and financial metrics discussed here reflect the stock's current position as of 08 June 2026, providing investors with an up-to-date view of the company’s performance and outlook.
Read full news article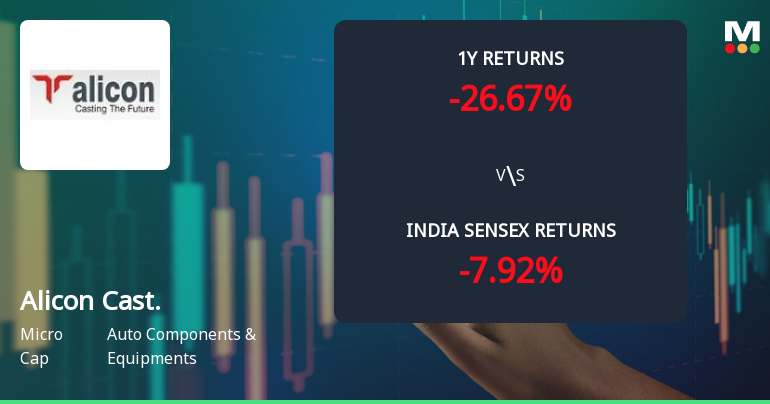
Alicon Castalloy Ltd Technical Momentum Shifts Amid Bearish Market Sentiment
Alicon Castalloy Ltd, a micro-cap player in the Auto Components & Equipments sector, has experienced a notable shift in its technical momentum, reflecting a complex interplay of bearish and mildly bullish signals. Despite a recent downgrade in its Mojo Grade from Hold to Sell, the stock’s technical indicators reveal nuanced trends that investors should carefully analyse amid ongoing market volatility.
Read full news article Announcements
Alicon Castalloy Limited - Other General Purpose
15-Nov-2019 | Source : NSEAlicon Castalloy Limited has informed the Exchange regarding Related Party Transaction for the Half Year ended September 30, 2019.
Alicon Castalloy Limited - Press Release
18-Oct-2019 | Source : NSEAlicon Castalloy Limited has informed the Exchange regarding a press release dated October 18, 2019, titled "Alicon Castalloy announces Q2 FY20 Earnings Total Income at Rs. 266.86 crore EBITDA grows 27% QoQ to Rs. 35.35 crore with improved margins PAT higher by 84% QoQ basis to Rs. 9.4 crore.".
Alicon Castalloy Limited - Analysts/Institutional Investor Meet/Con. Call Updates
17-Oct-2019 | Source : NSEAlicon Castalloy Limited has informed the Exchange regarding Analysts/Institutional Investor Meet/Con. Call Updates
Corporate Actions

No Upcoming Board Meetings

Alicon Castalloy Ltd has declared 40% dividend, ex-date: 19 May 26

Alicon Castalloy Ltd has announced 5:10 stock split, ex-date: 04 Dec 06

No Bonus history available

No Rights history available
Quality key factors
Valuation key factors
Technicals key factors
 Technical Indicator Scale: Bearish, Mildly Bearish, Sideways, Mildly Bullish, Bullish Turned
 Shareholding Snapshot : Mar 2026
Shareholding Compare (%holding)
Promoters
None
Held by 3 Schemes (11.4%)
Held by 11 FIIs (0.2%)
Nastic Trading Llp . (41.4%)
Enkei Corporation (13.63%)
13.21%
Quarterly Results Snapshot (Consolidated) - Mar'26 - QoQ

QoQ Growth in quarter ended Mar 2026 is 15.08% vs 0.45% in Dec 2025
QoQ Growth in quarter ended Mar 2026 is 140.61% vs -76.24% in Dec 2025
Half Yearly Results Snapshot (Consolidated) - Sep'25

Growth in half year ended Sep 2025 is -6.37% vs 22.94% in Sep 2024
Growth in half year ended Sep 2025 is -35.29% vs 49.38% in Sep 2024
Nine Monthly Results Snapshot (Consolidated) - Dec'25
YoY Growth in nine months ended Dec 2025 is -1.51% vs 13.66% in Dec 2024
YoY Growth in nine months ended Dec 2025 is -27.65% vs -10.09% in Dec 2024
Annual Results Snapshot (Consolidated) - Mar'26
YoY Growth in year ended Mar 2026 is 3.22% vs 10.32% in Mar 2025
YoY Growth in year ended Mar 2026 is -25.23% vs -24.84% in Mar 2025
About Alicon Castalloy Ltd

Company Coordinates


