
Compare The Hi-Tech Gear with Similar Stocks
Dashboard
Weak Long Term Fundamental Strength with a -6.33% CAGR growth in Operating Profits over the last 5 years
- The company has been able to generate a Return on Equity (avg) of 5.86% signifying low profitability per unit of shareholders funds
Negative results in Mar 26
With ROCE of 5, it has a Expensive valuation with a 1.9 Enterprise value to Capital Employed
Despite the size of the company, domestic mutual funds hold only 0% of the company
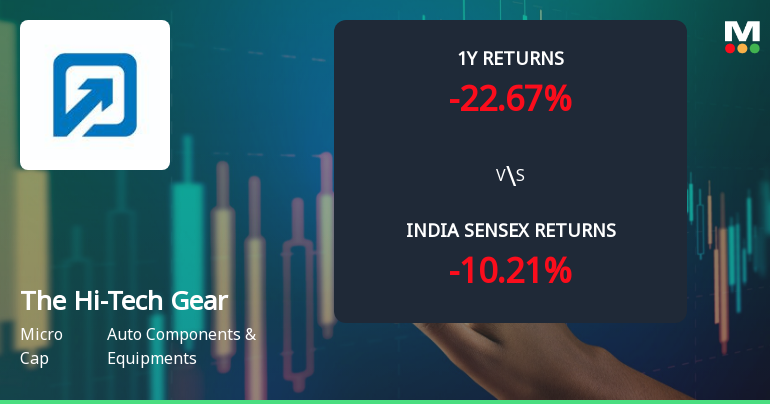
Underperformed the market in the last 1 year
Stock DNA
Auto Components & Equipments
INR 1,092 Cr (Micro Cap)
53.00
35
0.86%
0.28
4.01%
2.09
Total Returns (Price + Dividend) 
Latest dividend: 5 per share ex-dividend date: Sep-19-2025
Risk Adjusted Returns v/s
Returns Beta

News
The Hi-Tech Gears Ltd Faces Bearish Momentum Amid Technical Downgrade
The Hi-Tech Gears Ltd, a micro-cap player in the Auto Components & Equipments sector, has experienced a notable shift in its technical momentum, with key indicators signalling a bearish trend. Despite a strong long-term performance, recent price action and technical parameters suggest increasing downside risks, prompting a downgrade in its Mojo Grade to Strong Sell as of 4 February 2026.
Read full news article
The Hi-Tech Gears Ltd: Technical Momentum Shifts Amid Mixed Market Signals
The Hi-Tech Gears Ltd, a micro-cap player in the Auto Components & Equipments sector, has exhibited a nuanced shift in its technical momentum, reflecting a complex interplay of bullish and bearish signals across multiple timeframes. Despite a recent upgrade from a Sell to a Strong Sell rating by MarketsMOJO, the stock’s price action and technical indicators reveal a landscape of cautious optimism tempered by persistent headwinds.
Read full news article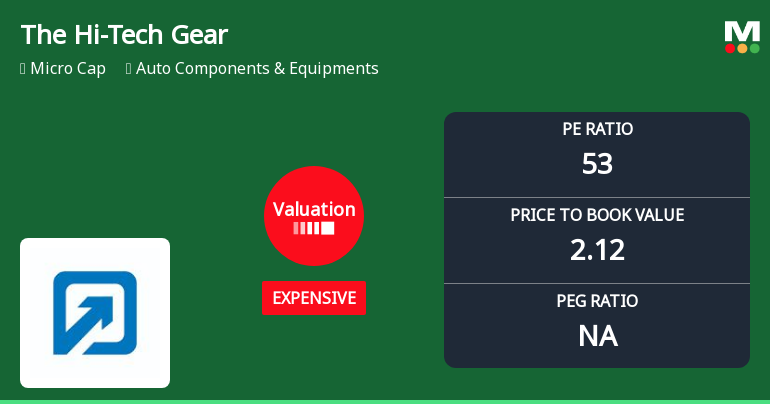
The Hi-Tech Gears Ltd Valuation Shifts to Expensive Amid Mixed Returns
The Hi-Tech Gears Ltd, a micro-cap player in the Auto Components & Equipments sector, has witnessed a marked shift in its valuation parameters, moving from fair to expensive territory. With a price-to-earnings (P/E) ratio soaring to 52.93 and a price-to-book value (P/BV) of 2.12, the stock’s price attractiveness has notably diminished compared to its historical averages and peer group benchmarks. This article analyses the implications of these valuation changes, juxtaposing them against sector peers and broader market trends to provide investors with a comprehensive perspective.
Read full news article Announcements
The Hi-Tech Gears Limited - Other General Purpose
03-Dec-2019 | Source : NSEThe Hi-Tech Gears Limited has informed the Exchange regarding Disclosure of Related Party Transactions on consolidated basis pursuant to Regulation 23(9) of the SEBI ( LODR) Regulations, 2015, ( Listing Regulations) for the period ended on September 30, 2019.
The Hi-Tech Gears Limited - Appointment
18-Nov-2019 | Source : NSEThe Hi-Tech Gears Limited has informed the Exchange regarding Appointment of Mr Naveen Jain as Company Secretary & Compliance Officer of the company w.e.f. November 18, 2019.
The Hi-Tech Gears Limited - Outcome of Board Meeting
05-Nov-2019 | Source : NSEThe Hi-Tech Gears Limited has informed the Exchange regarding Board meeting held on November 04, 2019.
Corporate Actions

No Upcoming Board Meetings

The Hi-Tech Gears Ltd has declared 50% dividend, ex-date: 19 Sep 25

No Splits history available

The Hi-Tech Gears Ltd has announced 1:1 bonus issue, ex-date: 01 Dec 10

No Rights history available
Quality key factors
Valuation key factors
Technicals key factors
 Technical Indicator Scale: Bearish, Mildly Bearish, Sideways, Mildly Bullish, Bullish Turned
 Shareholding Snapshot : Mar 2026
Shareholding Compare (%holding)
Promoters
None
Held by 0 Schemes
Held by 3 FIIs (0.0%)
Deep Kapuria (16.56%)
Manohar Devabhaktuni (2.06%)
19.43%
Quarterly Results Snapshot (Consolidated) - Mar'26 - QoQ

QoQ Growth in quarter ended Mar 2026 is 2.28% vs -7.15% in Dec 2025
QoQ Growth in quarter ended Mar 2026 is 843.02% vs -85.69% in Dec 2025
Half Yearly Results Snapshot (Consolidated) - Sep'25

Growth in half year ended Sep 2025 is -10.01% vs -7.33% in Sep 2024
Growth in half year ended Sep 2025 is -49.50% vs -70.83% in Sep 2024
Nine Monthly Results Snapshot (Consolidated) - Dec'25
YoY Growth in nine months ended Dec 2025 is -4.53% vs -13.17% in Dec 2024
YoY Growth in nine months ended Dec 2025 is -58.01% vs -68.22% in Dec 2024
Annual Results Snapshot (Consolidated) - Mar'26
YoY Growth in year ended Mar 2026 is -2.00% vs -16.26% in Mar 2025
YoY Growth in year ended Mar 2026 is -48.02% vs -64.67% in Mar 2025
About The Hi-Tech Gears Ltd

Company Coordinates


