
Compare Alivus Life with Similar Stocks
Dashboard
High Management Efficiency with a high ROE of 19.43%
The company is Net-Debt Free
Poor long term growth as Net Sales has grown by an annual rate of 6.24% and Operating profit at 5.36% over the last 5 years
Flat results in Jun 26
With ROE of 17.5, it has a Fair valuation with a 4.1 Price to Book Value
Majority shareholders : Promoters
Market Beating performance in long term as well as near term
Stock DNA
Pharmaceuticals & Biotechnology
INR 14,148 Cr (Small Cap)
23.00
37
0.45%
-0.22
17.52%
4.09
Total Returns (Price + Dividend) 
Latest dividend: 5 per share ex-dividend date: Sep-01-2025
Risk Adjusted Returns v/s
Returns Beta

News
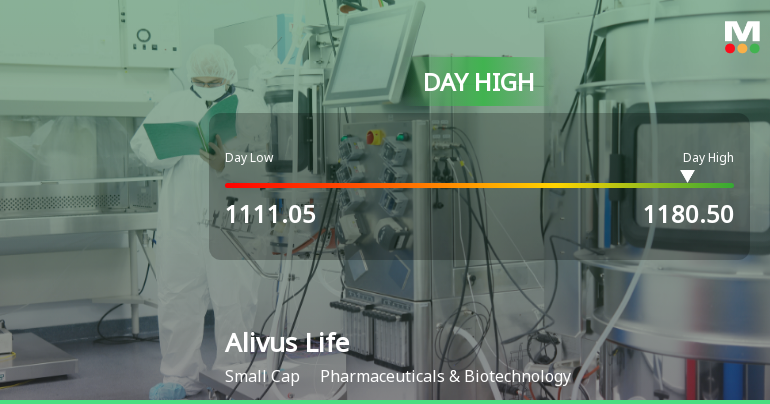
Alivus Life Sciences Ltd Surges 7.33% to Day's High of Rs 1167.7 — Outperforms Sector by 5.26 Percentage Points
The Sensex edged up 0.14% on 31 Jul 2026, while Alivus Life Sciences Ltd surged 7.33%, outperforming its Pharmaceuticals & Biotechnology sector by 5.26 percentage points. This sharp single-session gain stands out as a stock-specific event amid a broadly positive but modest market advance.
Read full news article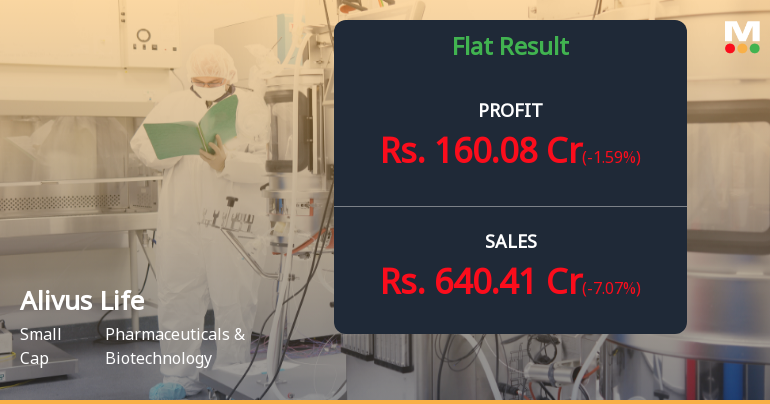
Alivus Life Sciences Q1 FY27: Margin Excellence Overshadowed by Revenue Decline
Alivus Life Sciences Ltd., a small-cap pharmaceutical company with a market capitalisation of ₹14,115.04 crores, reported a mixed performance in Q1 FY27, with net profit climbing to ₹160.08 crores but revenue contracting quarter-on-quarter. The stock surged 4.98% on the day of this analysis, trading at ₹1,150.00, reflecting investor optimism about the company's margin expansion despite top-line headwinds.
Read full news article Announcements
Closure of Trading Window
23-Jul-2026 | Source : BSEIntimation of closure of Trading Window from 1st July 2026 to 1st August 2026 (both days inclusive) for the purpose of approval of unaudited financial results for the quarter ended 30th June 2026.
Announcement under Regulation 30 (LODR)-Analyst / Investor Meet - Intimation
23-Jul-2026 | Source : BSEEnclosed please find herewith the details of Earnings Call slated for Friday July 31 2026 from 8:30 a.m. to 9:30 a.m. (IST) for your information and record.
Board Meeting Intimation for Considering And Approving Unaudited Financial Results Of The Company For The Quarter Ended 30Th June 2026.
23-Jul-2026 | Source : BSEAlivus Life Sciences Ltdhas informed BSE that the meeting of the Board of Directors of the Company is scheduled on 30/07/2026 inter alia to consider and approve the Unaudited Financial Results of the Company for the quarter ended 30th June 2026.
Corporate Actions

No Upcoming Board Meetings

Alivus Life Sciences Ltd has declared 250% dividend, ex-date: 01 Sep 25

No Splits history available

No Bonus history available

No Rights history available
Quality key factors
Valuation key factors
Technicals key factors
 Technical Indicator Scale: Bearish, Mildly Bearish, Sideways, Mildly Bullish, Bullish Turned
 Shareholding Snapshot : Jun 2026
Shareholding Compare (%holding)
Promoters
None
Held by 14 Schemes (5.65%)
Held by 68 FIIs (5.54%)
Nirma Limited (74.87%)
Quant Mutual Fund - Quant Small Cap Fund (2.51%)
10.05%
Quarterly Results Snapshot (Standalone) - Jun'26 - QoQ

QoQ Growth in quarter ended Jun 2026 is -7.07% vs 2.41% in Mar 2026
QoQ Growth in quarter ended Jun 2026 is -1.59% vs 8.25% in Mar 2026
Half Yearly Results Snapshot (Standalone) - Sep'25

Growth in half year ended Sep 2025 is 8.61% vs -6.67% in Sep 2024
Growth in half year ended Sep 2025 is 21.64% vs -18.64% in Sep 2024
Nine Monthly Results Snapshot (Standalone) - Dec'25
YoY Growth in nine months ended Dec 2025 is 7.22% vs -0.53% in Dec 2024
YoY Growth in nine months ended Dec 2025 is 16.89% vs -7.83% in Dec 2024
Annual Results Snapshot (Standalone) - Mar'26
YoY Growth in year ended Mar 2026 is 6.91% vs 4.54% in Mar 2025
YoY Growth in year ended Mar 2026 is 16.24% vs 3.13% in Mar 2025
About Alivus Life Sciences Ltd

Company Coordinates


