
Compare Concord Biotech with Similar Stocks
Stock DNA
Pharmaceuticals & Biotechnology
INR 14,124 Cr (Small Cap)
52.00
34
0.80%
-0.20
13.06%
6.93
Total Returns (Price + Dividend) 
Latest dividend: 10.699999999999998 per share ex-dividend date: Sep-03-2025
Risk Adjusted Returns v/s
Returns Beta

News

Concord Biotech Ltd is Rated Sell
Concord Biotech Ltd is rated Sell by MarketsMOJO, with this rating last updated on 15 June 2026. While the rating change occurred on that date, the analysis and financial metrics discussed here reflect the stock’s current position as of 22 June 2026, providing investors with the most up-to-date perspective on the company’s performance and outlook.
Read full news article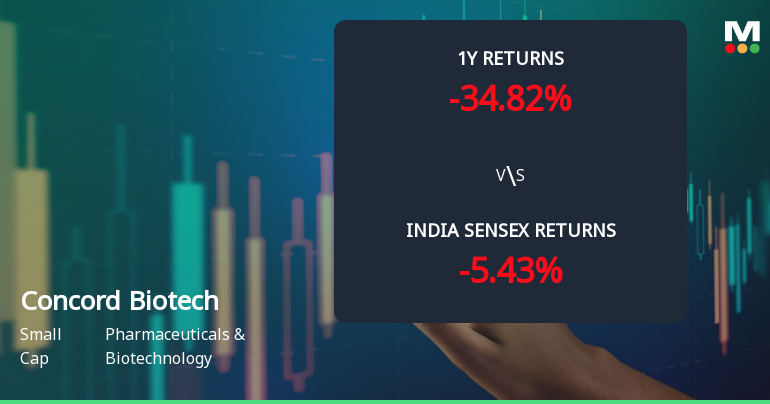
Concord Biotech Ltd Faces Technical Momentum Shift Amid Mixed Market Signals
Concord Biotech Ltd, a small-cap player in the Pharmaceuticals & Biotechnology sector, has experienced a notable shift in its technical momentum, reflecting a complex interplay of bullish and bearish signals. Recent technical parameter changes have prompted a downgrade in its Mojo Grade from Hold to Sell, signalling caution for investors amid sideways price action and mixed indicator readings.
Read full news article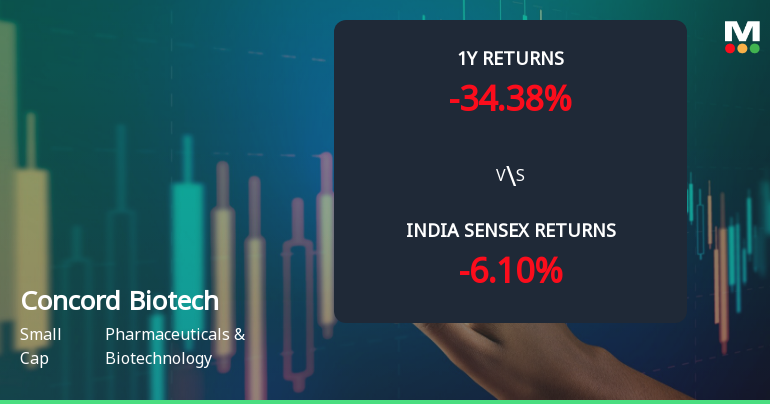
Concord Biotech Ltd Technical Momentum Shifts Amid Mixed Market Signals
Concord Biotech Ltd, a small-cap player in the Pharmaceuticals & Biotechnology sector, has experienced a notable shift in its technical momentum, moving from a sideways trend to a mildly bullish stance. Despite a recent downgrade in its Mojo Grade from Hold to Sell, the stock’s technical indicators present a complex picture, with mixed signals across weekly and monthly timeframes.
Read full news article Announcements
Announcement under Regulation 30 (LODR)-Acquisition
20-Jun-2026 | Source : BSEWe are pleased to announce that the Company has entered into an agreement to Invest in M/s. FSGE Renewable Power Private Limited for installation of Wind Solar Hybrid Power Project having a wind capacity of approximately 6.3 MW AC & solar capacity of approximately 6.3 MWp DC in Gujarat for Limbasi Facility of the Company.
Announcement under Regulation 30 (LODR)-Analyst / Investor Meet - Intimation
19-Jun-2026 | Source : BSEIntimation of Schedule of Analyst / Institutional Investor meetings under the SEBI (Listing Obligations and Disclosure Requirements) Regulations 2015 scheduled to be held on 24th & 25th June 2026.
Announcement under Regulation 30 (LODR)-Analyst / Investor Meet - Intimation
13-Jun-2026 | Source : BSEIntimation of Schedule of Analyst / Institutional Investor meeting to be held on June 17 2026 at 10:30 AM
Corporate Actions

No Upcoming Board Meetings

Concord Biotech Ltd has declared 1070% dividend, ex-date: 03 Sep 25

No Splits history available

No Bonus history available

No Rights history available
Quality key factors
Valuation key factors
Technicals key factors
 Technical Indicator Scale: Bearish, Mildly Bearish, Sideways, Mildly Bullish, Bullish Turned
 Shareholding Snapshot : Mar 2026
Shareholding Compare (%holding)
Promoters
None
Held by 22 Schemes (4.3%)
Held by 94 FIIs (7.8%)
Sudhir Kumar Vaid (28.84%)
Aryavir Jhunjhunwala Discretionary Trust (8.03%)
8.09%
Quarterly Results Snapshot (Consolidated) - Mar'26 - QoQ

QoQ Growth in quarter ended Mar 2026 is 17.39% vs 12.43% in Dec 2025
QoQ Growth in quarter ended Mar 2026 is 37.70% vs 1.42% in Dec 2025
Half Yearly Results Snapshot (Consolidated) - Sep'25

Growth in half year ended Sep 2025 is -14.25% vs 15.05% in Sep 2024
Growth in half year ended Sep 2025 is -30.70% vs 14.63% in Sep 2024
Nine Monthly Results Snapshot (Consolidated) - Dec'25
YoY Growth in nine months ended Dec 2025 is -5.37% vs 10.35% in Dec 2024
YoY Growth in nine months ended Dec 2025 is -25.57% vs 8.53% in Dec 2024
Annual Results Snapshot (Consolidated) - Mar'26
YoY Growth in year ended Mar 2026 is -12.10% vs 18.01% in Mar 2025
YoY Growth in year ended Mar 2026 is -29.79% vs 20.62% in Mar 2025
About Concord Biotech Ltd

Company Coordinates


