
Compare Alphageo (India) with Similar Stocks
Dashboard
With a Operating Losses, the company has a Weak Long Term Fundamental Strength
- Company's ability to service its debt is weak with a poor EBIT to Interest (avg) ratio of -7.59
- The company has been able to generate a Return on Equity (avg) of 2.14% signifying low profitability per unit of shareholders funds
The company has declared Negative results for the last 3 consecutive quarters
Risky - Negative EBITDA
Stock DNA
Oil
INR 155 Cr (Micro Cap)
NA (Loss Making)
14
3.66%
-0.52
-5.49%
0.55
Total Returns (Price + Dividend) 
Latest dividend: 8 per share ex-dividend date: Sep-19-2025
Risk Adjusted Returns v/s
Returns Beta

News
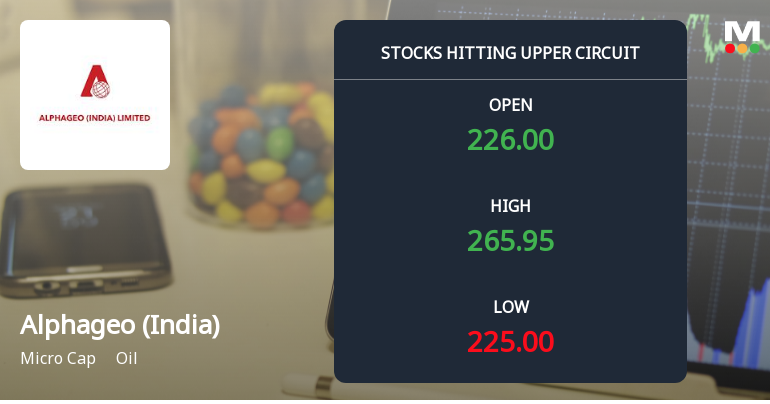
Micro-Cap Alphageo (India) Ltd Locks at Upper Circuit — Rs 4.97 Crore Turnover and Rising Delivery Tell the Story
At Rs 264.15, the buying was done — not because demand dried up, but because the exchange wouldn't let the stock go any higher. Alphageo (India) Ltd locked at its upper circuit of 20% on 3 Aug 2026, with buyers queuing and no sellers willing to part with shares, signalling unfilled demand in this micro-cap oil sector stock.
Read full news article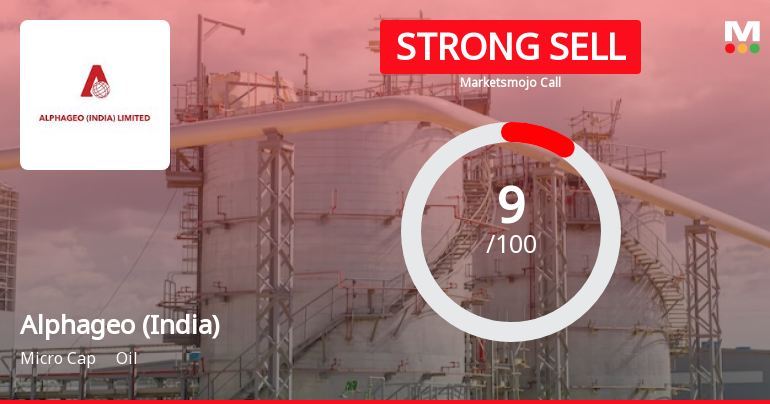
Alphageo (India) Ltd is Rated Strong Sell
Alphageo (India) Ltd is rated Strong Sell by MarketsMOJO, with this rating last updated on 19 Sep 2025. However, the analysis and financial metrics discussed here reflect the company’s current position as of 30 July 2026, providing investors with an up-to-date perspective on the stock’s fundamentals, valuation, financial trends, and technical outlook.
Read full news article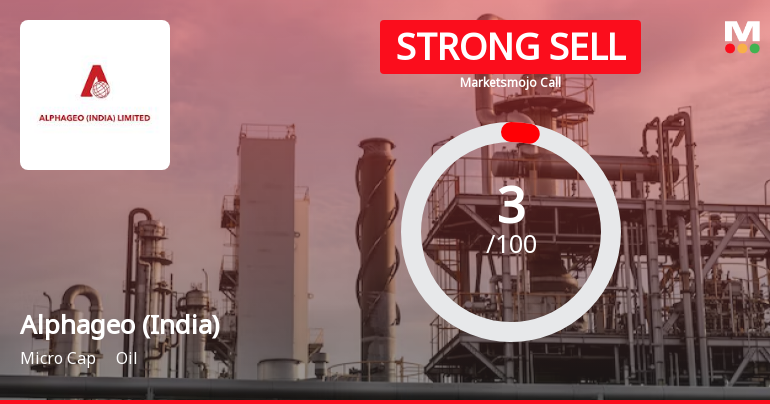
Alphageo (India) Ltd is Rated Strong Sell
Alphageo (India) Ltd is rated Strong Sell by MarketsMOJO, with this rating last updated on 19 Sep 2025. However, the analysis and financial metrics discussed here reflect the company’s current position as of 19 July 2026, providing investors with the latest insights into its performance and outlook.
Read full news article Announcements
Announcement under Regulation 30 (LODR)-Newspaper Publication
18-Jul-2026 | Source : BSECopies of Newspaper advertisement published on July 18 2026
Compliances-Certificate under Reg. 74 (5) of SEBI (DP) Regulations 2018
07-Jul-2026 | Source : BSECertificate under Regulation 74(5) of the SEBI (DP) Regulations 2018 for the quarter ended 30th June 2026
Closure of Trading Window
24-Jun-2026 | Source : BSEIntimation of Closure of Trading Window
Corporate Actions

No Upcoming Board Meetings

Alphageo (India) Ltd has declared 80% dividend, ex-date: 19 Sep 25

No Splits history available

No Bonus history available

No Rights history available
Quality key factors
Valuation key factors
Technicals key factors
 Technical Indicator Scale: Bearish, Mildly Bearish, Sideways, Mildly Bullish, Bullish Turned
 Shareholding Snapshot : Jun 2026
Shareholding Compare (%holding)
Non Institution
9.5837
Held by 2 Schemes (0.03%)
Held by 2 FIIs (0.94%)
Alla Dinesh (15.08%)
Shashank Sharad Khade (2.26%)
43.01%
Quarterly Results Snapshot (Consolidated) - Mar'26 - QoQ

QoQ Growth in quarter ended Mar 2026 is 192.70% vs 223.85% in Dec 2025

QoQ Growth in quarter ended Mar 2026 is 47.63% vs -3.15% in Dec 2025
Half Yearly Results Snapshot (Consolidated) - Sep'25
Growth in half year ended Sep 2025 is 4.75% vs 483.80% in Sep 2024
Growth in half year ended Sep 2025 is -188.95% vs 173.11% in Sep 2024
Nine Monthly Results Snapshot (Consolidated) - Dec'25
YoY Growth in nine months ended Dec 2025 is 14.10% vs 17.85% in Dec 2024
YoY Growth in nine months ended Dec 2025 is -363.95% vs 35.10% in Dec 2024
Annual Results Snapshot (Consolidated) - Mar'26
YoY Growth in year ended Mar 2026 is -10.75% vs 27.37% in Mar 2025
YoY Growth in year ended Mar 2026 is -127.33% vs -1,707.89% in Mar 2025
About Alphageo (India) Ltd

Company Coordinates


