
Compare Alphatec Holdings, Inc. with Similar Stocks
Stock DNA
Pharmaceuticals & Biotechnology
USD 2,530 Million (Small Cap)
NA (Loss Making)
NA
0.00%
11.69
-325.84%
72.06
Total Returns (Price + Dividend) 
Alphatec Holdings, Inc. for the last several years.
Risk Adjusted Returns v/s
News
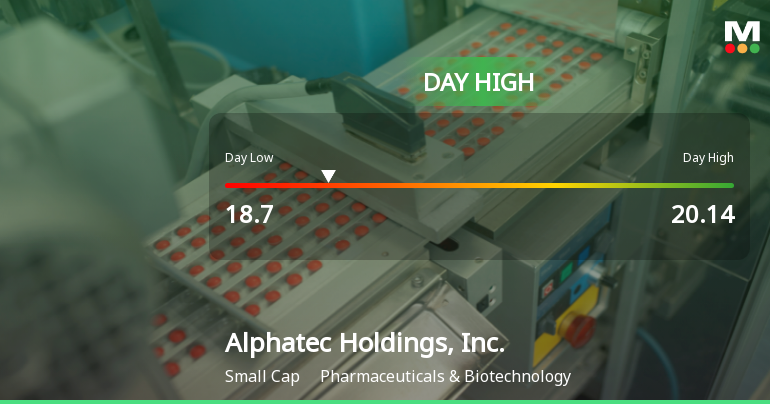
Alphatec Holdings Hits Day High with 16.29% Surge in Stock Price
Alphatec Holdings, Inc. has seen a notable increase in its stock price, significantly outperforming the S&P 500 over various time frames. However, the company faces challenges with negative EBITDA and a high price-to-book ratio, raising concerns about its profitability and valuation as it navigates the market.
Read full news article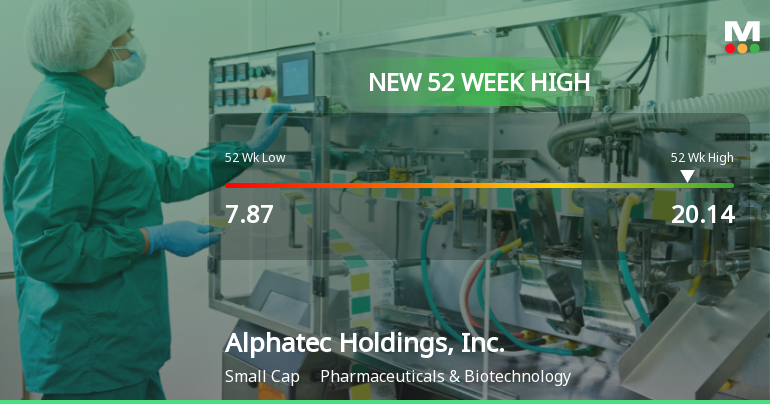
Alphatec Holdings Hits New 52-Week High of $20.14
Alphatec Holdings, Inc. has achieved a new 52-week high of USD 20.14, reflecting an impressive one-year performance of 85.27%. With a market capitalization of USD 2,448 million, the company operates in a competitive pharmaceuticals and biotechnology sector, despite facing challenges such as a negative return on equity.
Read full news article
Alphatec Holdings Hits New 52-Week High at $17.14
Alphatec Holdings, Inc. has achieved a new 52-week high of USD 17.14, significantly up from its low of USD 5.36, reflecting a year-over-year performance improvement. With a market cap of USD 2,448 million, the company faces challenges, including a high debt-to-equity ratio and negative return on equity.
Read full news article Announcements

Corporate Actions
Quality key factors
Valuation key factors
Technicals key factors
 Technical Indicator Scale: Bearish, Mildly Bearish, Sideways, Mildly Bullish, Bullish Turned
 Shareholding Snapshot : Sep 2025
Shareholding Compare (%holding)
Domestic Funds
Held in 59 Schemes (23.76%)
Held by 87 Foreign Institutions (11.07%)
Quarterly Results Snapshot (Consolidated) - Sep'25 - YoY

YoY Growth in quarter ended Sep 2025 is 30.39% vs 27.39% in Sep 2024
YoY Growth in quarter ended Sep 2025 is 27.78% vs 7.26% in Sep 2024
Annual Results Snapshot (Consolidated) - Dec'24

YoY Growth in year ended Dec 2024 is 26.81% vs 37.45% in Dec 2023
YoY Growth in year ended Dec 2024 is 13.13% vs -23.33% in Dec 2023
About Alphatec Holdings, Inc.

Company Coordinates


