
Compare American Eagle Outfitters, Inc. with Similar Stocks
Total Returns (Price + Dividend) 
American Eagle Outfitters, Inc. for the last several years.
Risk Adjusted Returns v/s
News

American Eagle Outfitters Hits New 52-Week High at $21.43
American Eagle Outfitters, Inc. achieved a new 52-week high, reflecting its performance in the footwear industry as a small-cap company. The firm has shown modest growth over the past year, with a strong dividend yield, solid financial health, and effective management of shareholder equity.
Read full news article
American Eagle Outfitters Hits New 52-Week High at $21.27
American Eagle Outfitters, Inc. achieved a new 52-week high of USD 21.27 on December 1, 2025, reflecting strong performance in the footwear industry. The company has a market capitalization of USD 4,657 million, a P/E ratio of 11.00, and a notable dividend yield of 107.02%.
Read full news article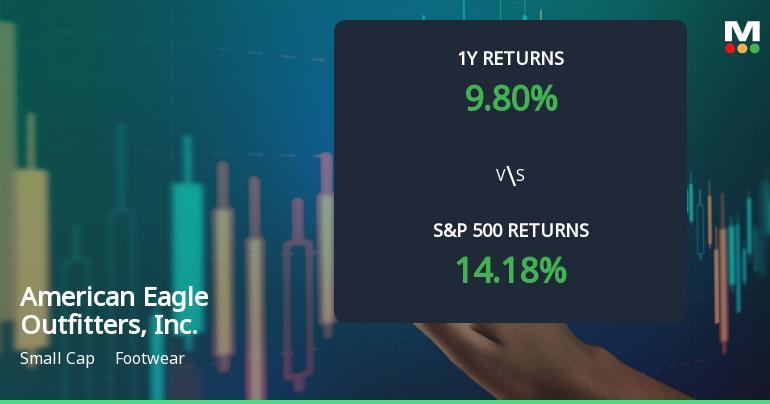
American Eagle Outfitters, Inc. Experiences Revision in Stock Evaluation Amid Market Dynamics
American Eagle Outfitters, Inc. has recently revised its evaluation, reflecting its adaptability in the footwear market. The company has shown resilience with a 9.80% stock return over the past year and a notable 22.38% year-to-date performance, highlighting its ability to navigate market challenges effectively.
Read full news article Announcements

Corporate Actions
Quality key factors
Valuation key factors
Technicals key factors
 Technical Indicator Scale: Bearish, Mildly Bearish, Sideways, Mildly Bullish, Bullish Turned
 Shareholding Snapshot : Oct 2025
Shareholding Compare (%holding)
Domestic Funds
Held in 99 Schemes (62.4%)
Held by 168 Foreign Institutions (15.07%)
Quarterly Results Snapshot (Consolidated) - Oct'25 - YoY

YoY Growth in quarter ended Oct 2025 is 5.71% vs -0.92% in Oct 2024
YoY Growth in quarter ended Oct 2025 is 14.13% vs -17.27% in Oct 2024
Annual Results Snapshot (Consolidated) - Jan'25

YoY Growth in year ended Jan 2025 is 1.27% vs 5.45% in Jan 2024
YoY Growth in year ended Jan 2025 is 93.76% vs 35.89% in Jan 2024
About American Eagle Outfitters, Inc.

Company Coordinates


