
Compare AMS Polymers with Similar Stocks
Stock DNA
Specialty Chemicals
INR 15 Cr (Micro Cap)
17.00
21
0.00%
2.40
13.27%
2.42
Total Returns (Price + Dividend) 
AMS Polymers for the last several years.
Risk Adjusted Returns v/s
Returns Beta

News
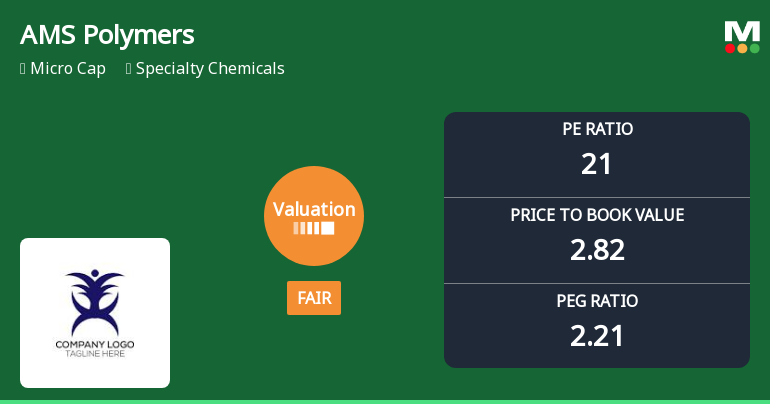
AMS Polymers Ltd Valuation Shifts to Fair Amid Mixed Market Performance
AMS Polymers Ltd, a micro-cap player in the specialty chemicals sector, has witnessed a notable shift in its valuation parameters, moving from an expensive to a fair valuation grade. This transition, coupled with a recent downgrade in its Mojo Grade from Hold to Sell, reflects evolving market perceptions amid fluctuating price-to-earnings and price-to-book ratios. Investors are advised to carefully analyse these changes in the context of the company’s financial metrics and sector peers.
Read full news article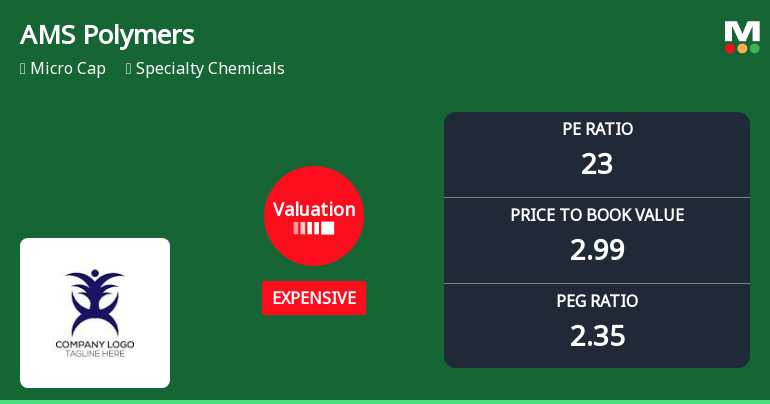
AMS Polymers Ltd Valuation Shifts Signal Price Attractiveness Challenges
AMS Polymers Ltd, a micro-cap player in the Specialty Chemicals sector, has seen a notable shift in its valuation parameters, moving from fair to expensive territory. This change, coupled with a recent downgrade in its Mojo Grade from Hold to Sell, raises important questions about the stock’s price attractiveness amid its strong historical returns and sector dynamics.
Read full news article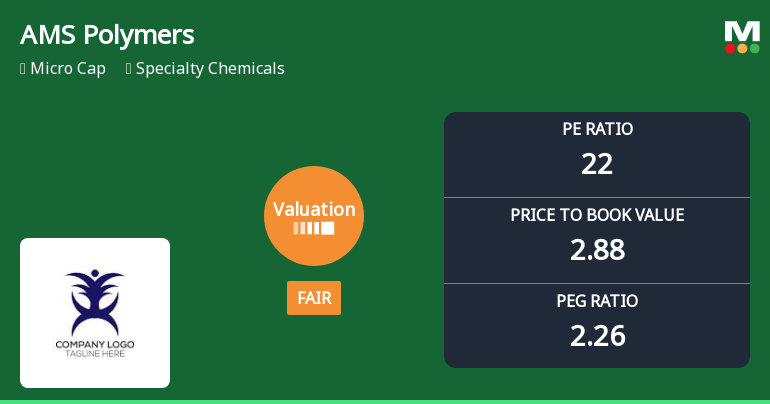
AMS Polymers Ltd Valuation Shifts to Fair Amid Mixed Market Performance
AMS Polymers Ltd, a micro-cap player in the Specialty Chemicals sector, has seen a notable shift in its valuation parameters, moving from an expensive to a fair valuation grade. This change comes amid significant price volatility and evolving market dynamics, prompting investors to reassess the stock’s price attractiveness relative to its historical averages and peer group.
Read full news article Announcements
Announcement under Regulation 30 (LODR)-Newspaper Publication
25-May-2026 | Source : BSENewspaper Publicaton of Audited Financial Results for the Quarter and year ended 31st March 2026
Compliances-Reg.24(A)-Annual Secretarial Compliance
23-May-2026 | Source : BSEThe Paid Up capital of the Company is 33025000 and net worth is 60325040. Therefore Company is exempted for submitting Annual Secretarial Compliance Report for the financial year 2025-26.
Non-Applicability Of Regulation 23(9) Of SEBI (Listing Obligations And Disclosure Requirements) 2015 For Quarter And Year Ended March 31 2026
23-May-2026 | Source : BSEThe disclosure related to related party transaction under regulation 23(9) of SEBI (LODR) Regulation 2015 is not applicable because neither paid up share capital nor net worth of the Company exceed the threshild limit.
Corporate Actions

No Upcoming Board Meetings

No Dividend history available

No Splits history available

No Bonus history available

No Rights history available
Quality key factors
Valuation key factors
Technicals key factors
 Technical Indicator Scale: Bearish, Mildly Bearish, Sideways, Mildly Bullish, Bullish Turned
 Shareholding Snapshot : Mar 2026
Shareholding Compare (%holding)
Non Institution
None
Held by 0 Schemes
Held by 0 FIIs
Anand Kumar (20.26%)
Vijay Kumar Agrawal (11.94%)
68.51%
Quarterly Results Snapshot (Standalone) - Mar'26 - YoY

YoY Growth in quarter ended Mar 2026 is 1.35% vs 55.79% in Mar 2025
YoY Growth in quarter ended Mar 2026 is -41.18% vs 1,800.00% in Mar 2025
Half Yearly Results Snapshot (Standalone) - Sep'25

Growth in half year ended Sep 2025 is 16.91% vs 2.16% in Sep 2024
Growth in half year ended Sep 2025 is 86.84% vs 15.15% in Sep 2024
Nine Monthly Results Snapshot (Standalone) - Dec'25
YoY Growth in nine months ended Dec 2025 is 9.86% vs 10.94% in Dec 2024
YoY Growth in nine months ended Dec 2025 is 20.69% vs -6.45% in Dec 2024
Annual Results Snapshot (Standalone) - Mar'26
YoY Growth in year ended Mar 2026 is 8.56% vs 20.61% in Mar 2025
YoY Growth in year ended Mar 2026 is 2.60% vs 26.23% in Mar 2025
About AMS Polymers Ltd

Company Coordinates


