
Compare Antelopus Selan with Similar Stocks
Dashboard
The company is Net-Debt Free
Healthy long term growth as Net Sales has grown by an annual rate of 41.70% and Operating profit at 65.93%
With a growth in Net Profit of 157.65%, the company declared Very Positive results in Mar 26
Market Beating performance in long term as well as near term
Total Returns (Price + Dividend) 
Latest dividend: 4.9870550161812295 per share ex-dividend date: Feb-17-2022
Risk Adjusted Returns v/s
Returns Beta

News
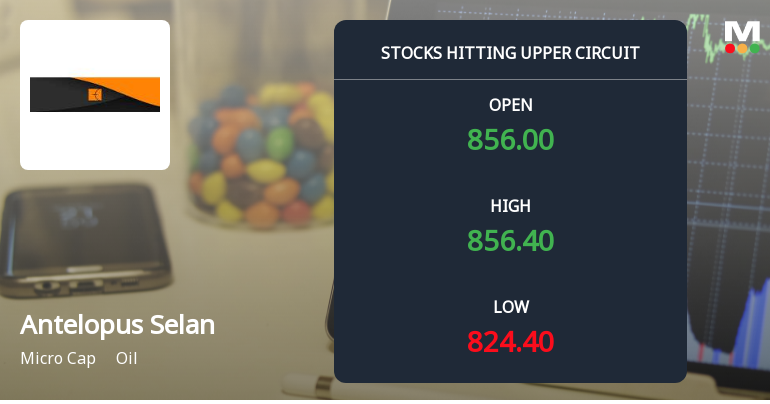
Antelopus Selan Energy Ltd Locks at Upper Circuit With 5% Gain — Buyers Queue, Sellers Absent
At Rs 854.6, the buying was done — not because demand dried up, but because the exchange wouldn't let the stock go any higher. Antelopus Selan Energy Ltd locked at its upper circuit of 5% on 23 Jun 2026, with buyers queuing and no sellers willing to part with shares.
Read full news article
Antelopus Selan Energy Ltd Locks at Upper Circuit With 5% Gain — Buyers Queue, Sellers Absent
At Rs 813.95, the buying was done — not because demand dried up, but because the exchange wouldn't let the stock go any higher. Antelopus Selan Energy Ltd locked at its upper circuit of 5% on 22 Jun 2026, with buyers queuing and no sellers willing to part with shares.
Read full news article
Antelopus Selan Energy Ltd Locks at Lower Circuit With 4.13% Loss — Sellers Queue, No Buyers in Sight
At Rs 761.9, Antelopus Selan Energy Ltd locked at its lower circuit on 16 Jun 2026, falling 4.13% within a 5% price band. Sellers remained lined up with no buyers willing to absorb the supply, resulting in a frozen price and unfilled sell orders throughout the session.
Read full news article Announcements
Disclosure Under Regulation 30 Read With Clause 15 Of Para A Of Part A Of Schedule III Of SEBI (Listing Obligations And Disclosure Requirements) Regulation 2015
20-Jun-2026 | Source : BSEIntimation regarding schedule of Analyst/ Institutional investor meet
Announcement under Regulation 30 (LODR)-Credit Rating
09-Jun-2026 | Source : BSEIntimation of Credit Rating assigned by India Ratings and Research
Intimation Regarding Upload Of Corporate Presentation On CompanyS Website
22-May-2026 | Source : BSEIntimation regarding upload of Corporate Presentation on Companys Website
Corporate Actions

No Upcoming Board Meetings

Antelopus Selan Energy Ltd has declared 50% dividend, ex-date: 17 Feb 22

No Splits history available

Antelopus Selan Energy Ltd has announced 1:10 bonus issue, ex-date: 31 Dec 10

No Rights history available
Quality key factors
Valuation key factors
Technicals key factors
 Technical Indicator Scale: Bearish, Mildly Bearish, Sideways, Mildly Bullish, Bullish Turned
 Shareholding Snapshot : Mar 2026
Shareholding Compare (%holding)
Promoters
None
Held by 0 Schemes
Held by 16 FIIs (0.26%)
Balckbuck Energy Investments Limited (69.93%)
Vineet Kaul (1.33%)
25.71%
Quarterly Results Snapshot (Standalone) - Mar'26 - YoY

YoY Growth in quarter ended Mar 2026 is 65.28% vs 12.79% in Mar 2025
YoY Growth in quarter ended Mar 2026 is 157.65% vs 20.65% in Mar 2025
Half Yearly Results Snapshot (Standalone) - Sep'25

Growth in half year ended Sep 2025 is -20.11% vs 96.67% in Sep 2024
Growth in half year ended Sep 2025 is -39.35% vs 162.59% in Sep 2024
Nine Monthly Results Snapshot (Standalone) - Dec'25
YoY Growth in nine months ended Dec 2025 is -9.93% vs 77.09% in Dec 2024
YoY Growth in nine months ended Dec 2025 is -7.65% vs 172.33% in Dec 2024
Annual Results Snapshot (Standalone) - Mar'26
YoY Growth in year ended Mar 2026 is 8.06% vs 55.85% in Mar 2025
YoY Growth in year ended Mar 2026 is 26.98% vs 115.55% in Mar 2025
About Antelopus Selan Energy Ltd

Company Coordinates


