
Compare Savita Oil Tech with Similar Stocks
Dashboard
The company is Net-Debt Free
Poor long term growth as Operating profit has grown by an annual rate -13.01% of over the last 5 years
The company has declared Positive results for the last 4 consecutive quarters
With ROE of 10, it has a Fair valuation with a 2 Price to Book Value
Majority shareholders : Promoters
Market Beating performance in long term as well as near term
Total Returns (Price + Dividend) 
Latest dividend: 4 per share ex-dividend date: Sep-15-2025
Risk Adjusted Returns v/s
Returns Beta

News
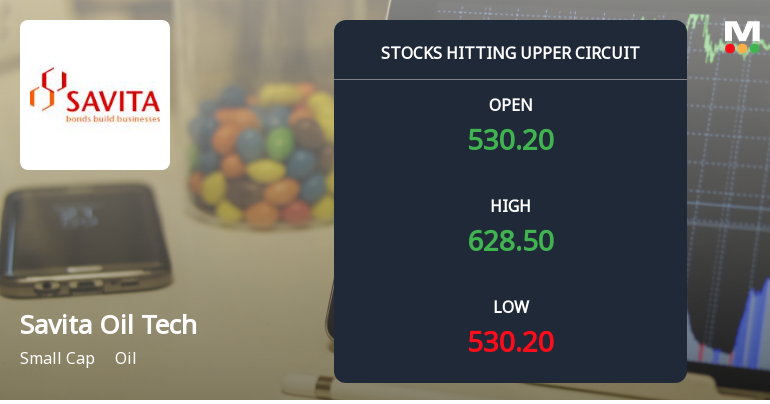
Savita Oil Technologies Ltd Locks at Upper Circuit With 13.9% Gain — Buyers Queue, Sellers Absent
At Rs 639.15, the buying was done — not because demand dried up, but because the exchange wouldn't let the stock go any higher. Savita Oil Technologies Ltd locked at its upper circuit of 20% on 6 Jul 2026, with buyers queuing and no sellers willing to part with shares.
Read full news article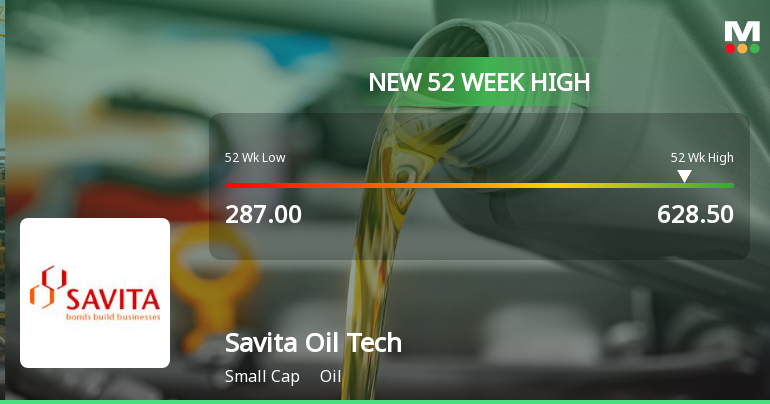
Broad-Based Technical Strength Lifts Savita Oil Technologies Ltd to 52-Week High of Rs 628.5
With a decisive surge to Rs 628.5 on 6 Jul 2026, Savita Oil Technologies Ltd has reached a fresh 52-week high, marking a remarkable rally from its low of Rs 287 in the past year. This milestone reflects a sustained momentum driven by a confluence of bullish technical indicators and strong price action that has outpaced both its sector and the broader market.
Read full news article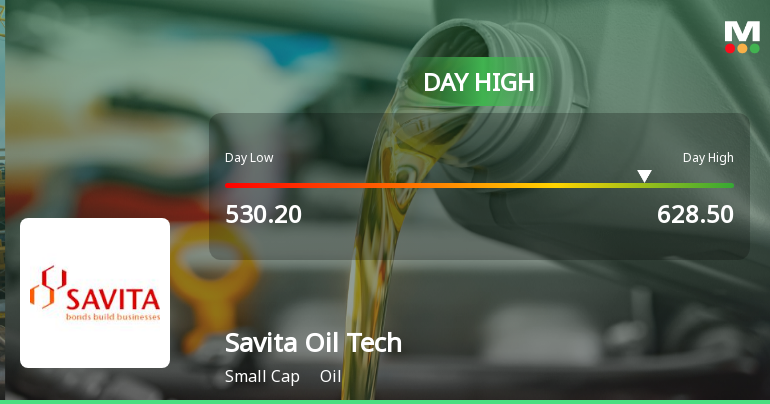
Savita Oil Technologies Ltd Surges 14.06% to Day's High of Rs 628.5 — Outperforms Sector by 12.29 Percentage Points
The Sensex advanced 0.35% on 6 Jul 2026, yet Savita Oil Technologies Ltd outpaced the broader market with a remarkable 14.06% gain, touching an intraday high of Rs 628.5. This 12.29 percentage-point outperformance over the Oil sector highlights a distinctly stock-specific rally rather than a market-wide surge.
Read full news article Announcements
Disclosures under Reg. 29(2) of SEBI (SAST) Regulations 2011
18-Jun-2026 | Source : BSEThe Exchange has received the disclosure under Regulation 29(2) of SEBI (Substantial Acquisition of Shares & Takeovers) Regulations 2011 for Siddharth Mehra
Disclosures under Reg. 10(6) of SEBI (SAST) Regulations 2011
18-Jun-2026 | Source : BSEThe Exchange has received the disclosure under Regulation 10(6) of SEBI (Substantial Acquisition of Shares & Takeovers) Regulations 2011 for Siddharth Mehra
Disclosures under Reg. 29(2) of SEBI (SAST) Regulations 2011
18-Jun-2026 | Source : BSEThe Exchange has received the disclosure under Regulation 29(2) of SEBI (Substantial Acquisition of Shares & Takeovers) Regulations 2011 for Gautam N Mehra
Corporate Actions

No Upcoming Board Meetings

Savita Oil Technologies Ltd has declared 200% dividend, ex-date: 15 Sep 25

Savita Oil Technologies Ltd has announced 2:10 stock split, ex-date: 01 Sep 22

Savita Oil Technologies Ltd has announced 2:3 bonus issue, ex-date: 17 Jan 07

No Rights history available
Quality key factors
Valuation key factors
Technicals key factors
 Technical Indicator Scale: Bearish, Mildly Bearish, Sideways, Mildly Bullish, Bullish Turned
 Shareholding Snapshot : Mar 2026
Shareholding Compare (%holding)
Promoters
None
Held by 3 Schemes (13.18%)
Held by 43 FIIs (0.88%)
Gautam N Mehra (on Behalf Of Mehra Syndicate, Aop) (59.71%)
Sbi Energy Opportunities Fund (6.63%)
13.57%
Quarterly Results Snapshot (Consolidated) - Mar'26 - QoQ

QoQ Growth in quarter ended Mar 2026 is 14.00% vs -0.21% in Dec 2025
QoQ Growth in quarter ended Mar 2026 is 24.74% vs -6.50% in Dec 2025
Half Yearly Results Snapshot (Consolidated) - Sep'25
Growth in half year ended Sep 2025 is 10.86% vs 2.96% in Sep 2024
Growth in half year ended Sep 2025 is 36.20% vs -30.91% in Sep 2024
Nine Monthly Results Snapshot (Consolidated) - Dec'25
YoY Growth in nine months ended Dec 2025 is 11.77% vs 1.47% in Dec 2024
YoY Growth in nine months ended Dec 2025 is 61.33% vs -50.95% in Dec 2024
Annual Results Snapshot (Consolidated) - Mar'26
YoY Growth in year ended Mar 2026 is 14.39% vs 1.95% in Mar 2025
YoY Growth in year ended Mar 2026 is 60.64% vs -43.61% in Mar 2025
About Savita Oil Technologies Ltd

Company Coordinates


