
Compare Apar Inds. with Similar Stocks
Dashboard
Strong Long Term Fundamental Strength with an average Return on Equity (ROE) of 20.31%
- Healthy long term growth as Net Sales has grown by an annual rate of 29.10% and Operating profit at 38.94%
- Company has a Debt to Equity ratio (avg) of 0.01 times
High Institutional Holdings at 33.53%
Company is among the highest 1% of companies rated by MarketsMojo across all 4,000 stocks
Market Beating performance in long term as well as near term
Stock DNA
Other Electrical Equipment
INR 66,948 Cr (Mid Cap)
64.00
60
0.31%
0.03
18.56%
12.43
Total Returns (Price + Dividend) 
Latest dividend: 51 per share ex-dividend date: Jul-29-2025
Risk Adjusted Returns v/s
Returns Beta

News
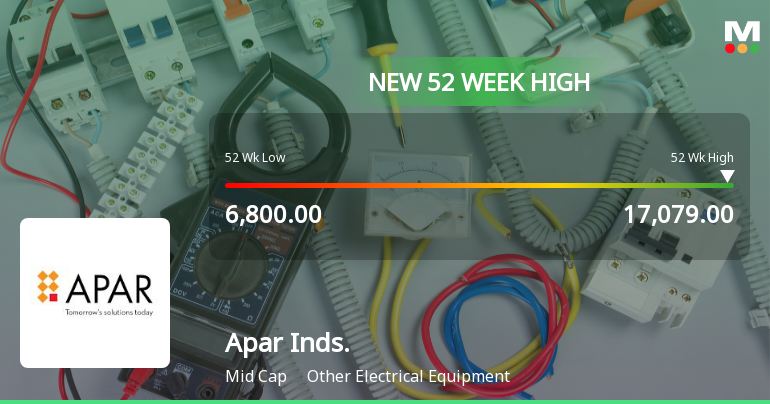
Broad-Based Technical Strength Lifts Apar Industries Ltd to 52-Week High of Rs 17148
Surging past its previous peaks, Apar Industries Ltd touched a new 52-week high of Rs 17,148 on 24 Jun 2026, marking a remarkable rally of 115.82% over the past year. This milestone is underpinned by a confluence of strong technical signals and sustained price momentum that have propelled the stock well above its key moving averages.
Read full news article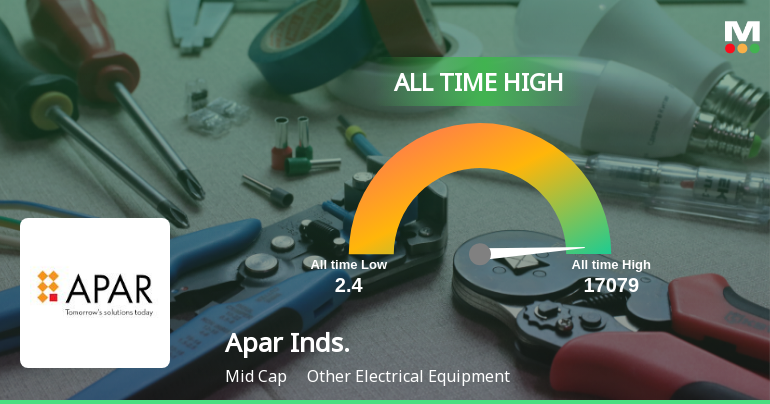
Apar Industries Ltd Hits All-Time High of Rs 17,079 as Momentum Builds Across Timeframes
Extending its recent winning streak, Apar Industries Ltd surged to a fresh all-time high of Rs 17,079 on 24 Jun 2026, outperforming both its sector and the broader market indices with a 2.30% gain on the day.
Read full news article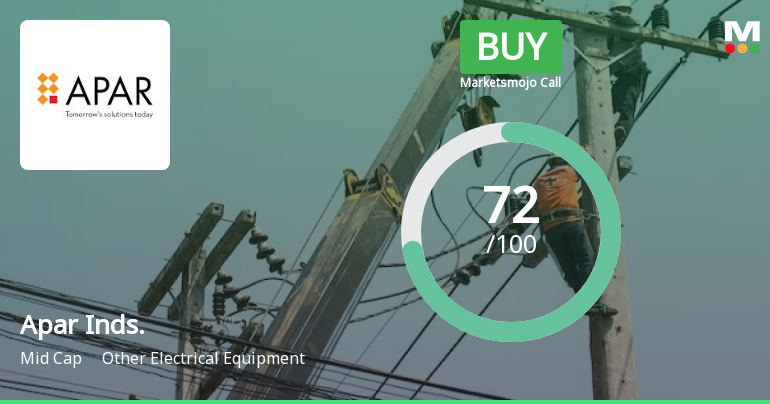
Apar Industries Ltd is Rated Buy
Apar Industries Ltd is currently rated as a Buy by MarketsMOJO. This rating was last updated on 29 May 2026. However, the analysis and financial metrics discussed here reflect the stock’s current position as of 23 June 2026, providing investors with the most up-to-date view of the company’s fundamentals, returns, and technical outlook.
Read full news article Announcements
Updates
02-Sep-2019 | Source : NSE
| Apar Industries Limited has informed the Exchange regarding 'Publication of Notice In Newspaper for transfer of Equity Shares to Investor Education and Protection Fund (IEPF)'. |
Analysts\/Institutional Investor Meet\/Con. Call Updates
27-Aug-2019 | Source : NSE
| Apar Industries Limited has informed the Exchange regarding Analysts/Institutional Investor Meet/Con. Call Updates. |
Shareholders meeting
09-Aug-2019 | Source : NSE
| Apar Industries Limited has submitted the Exchange a copy Srutinizers report of Annual General Meeting held on August 08, 2019. Further, the company has informed the Exchange regarding voting results. |
Corporate Actions

No Upcoming Board Meetings

Apar Industries Ltd has declared 510% dividend, ex-date: 29 Jul 25

No Splits history available

Apar Industries Ltd has announced 1:3 bonus issue, ex-date: 11 Jan 07

No Rights history available
Quality key factors
Valuation key factors
Technicals key factors
 Technical Indicator Scale: Bearish, Mildly Bearish, Sideways, Mildly Bullish, Bullish Turned
 Shareholding Snapshot : Mar 2026
Shareholding Compare (%holding)
Promoters
None
Held by 34 Schemes (22.25%)
Held by 222 FIIs (9.37%)
Chaitanya N Desai (22.7%)
Axis Mutual Fund Trustee Limited A/c Axis Mutual Fund A/c Axis Midcap Fund (4.34%)
6.88%
Quarterly Results Snapshot (Consolidated) - Mar'26 - YoY

YoY Growth in quarter ended Mar 2026 is 26.74% vs 16.94% in Mar 2025

YoY Growth in quarter ended Mar 2026 is 1.38% vs 5.83% in Mar 2025
Half Yearly Results Snapshot (Consolidated) - Sep'25
Growth in half year ended Sep 2025 is 25.01% vs 12.42% in Sep 2024
Growth in half year ended Sep 2025 is 29.82% vs 6.76% in Sep 2024
Nine Monthly Results Snapshot (Consolidated) - Dec'25
YoY Growth in nine months ended Dec 2025 is 21.90% vs 14.21% in Dec 2024
YoY Growth in nine months ended Dec 2025 is 26.64% vs -2.98% in Dec 2024
Annual Results Snapshot (Consolidated) - Mar'26
YoY Growth in year ended Mar 2026 is 23.25% vs 15.03% in Mar 2025
YoY Growth in year ended Mar 2026 is 18.95% vs -0.46% in Mar 2025
About Apar Industries Ltd

Company Coordinates


