
Compare Apollo Micro Sys with Similar Stocks
Stock DNA
Aerospace & Defense
INR 14,011 Cr (Small Cap)
124.00
56
0.05%
0.29
8.60%
10.84
Total Returns (Price + Dividend) 
Latest dividend: 0.25 per share ex-dividend date: Sep-09-2025
Risk Adjusted Returns v/s
Returns Beta

News

Apollo Micro Systems Ltd Downgraded to 'Buy' Amid Mixed Technical and Valuation Signals
Apollo Micro Systems Ltd, a prominent player in the Aerospace & Defense sector, has seen its investment rating adjusted from Strong Buy to Buy as of 27 July 2026. This recalibration reflects a nuanced assessment across quality, valuation, financial trends, and technical indicators, signalling a more cautious stance despite the company’s robust fundamentals and impressive long-term returns.
Read full news article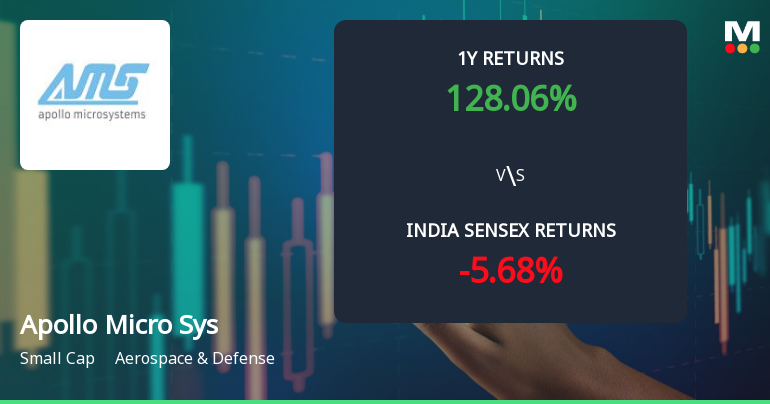
Apollo Micro Systems Ltd Sees Technical Momentum Shift Amid Mixed Indicator Signals
Apollo Micro Systems Ltd, a small-cap player in the Aerospace & Defense sector, has experienced a subtle shift in its technical momentum, moving from a bullish to a mildly bullish stance. Despite a slight dip in its share price, the company’s technical indicators present a nuanced picture, reflecting both strength and caution for investors analysing its near-term prospects.
Read full news article
Apollo Micro Systems Ltd is Rated Strong Buy
Apollo Micro Systems Ltd is rated Strong Buy by MarketsMOJO, with this rating last updated on 25 May 2026. However, the analysis and financial metrics discussed here reflect the company’s current position as of 17 July 2026, providing investors with the latest insights into its performance and outlook.
Read full news article Announcements
Announcement under Regulation 30 (LODR)-Press Release / Media Release
28-Jul-2026 | Source : BSEApollo Micro Systems Limited press release
General Updates
28-Jul-2026 | Source : BSEGeneral Updates
Intimation Of Trading Approvals
23-Jul-2026 | Source : BSEListing of further issue of shares on preferential basis- Trading approval -equity shares
Corporate Actions

No Upcoming Board Meetings

Apollo Micro Systems Ltd has declared 25% dividend, ex-date: 09 Sep 25

Apollo Micro Systems Ltd has announced 1:10 stock split, ex-date: 04 May 23

No Bonus history available

No Rights history available
Quality key factors
Valuation key factors
Technicals key factors
 Technical Indicator Scale: Bearish, Mildly Bearish, Sideways, Mildly Bullish, Bullish Turned
 Shareholding Snapshot : Jun 2026
Shareholding Compare (%holding)
Promoters
30.5057
Held by 9 Schemes (1.47%)
Held by 32 FIIs (7.59%)
Karunakar Reddy Baddam (45.46%)
Ebisu Global Opportunities Fund Limited (2.69%)
32.85%
Quarterly Results Snapshot (Consolidated) - Mar'26 - YoY

YoY Growth in quarter ended Mar 2026 is 81.28% vs 19.44% in Mar 2025
YoY Growth in quarter ended Mar 2026 is 168.71% vs 8.19% in Mar 2025
Half Yearly Results Snapshot (Consolidated) - Sep'25

Growth in half year ended Sep 2025 is 42.45% vs 73.91% in Sep 2024
Growth in half year ended Sep 2025 is 105.64% vs 193.55% in Sep 2024
Nine Monthly Results Snapshot (Consolidated) - Dec'25
YoY Growth in nine months ended Dec 2025 is 52.65% vs 69.48% in Dec 2024
YoY Growth in nine months ended Dec 2025 is 77.64% vs 133.17% in Dec 2024
Annual Results Snapshot (Consolidated) - Mar'26
YoY Growth in year ended Mar 2026 is 60.89% vs 51.24% in Mar 2025
YoY Growth in year ended Mar 2026 is 100.21% vs 81.23% in Mar 2025
About Apollo Micro Systems Ltd

Company Coordinates


