
Compare Apollo Micro Sys with Similar Stocks
Stock DNA
Aerospace & Defense
INR 15,713 Cr (Small Cap)
139.00
53
0.05%
0.29
8.60%
11.59
Total Returns (Price + Dividend) 
Latest dividend: 0.25 per share ex-dividend date: Sep-09-2025
Risk Adjusted Returns v/s
Returns Beta

News
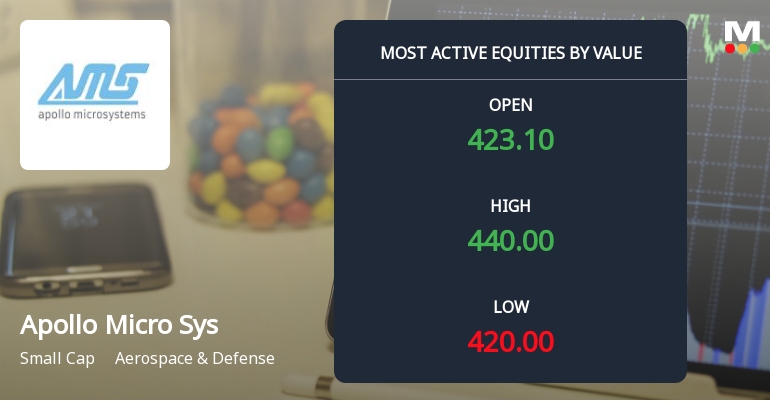
Apollo Micro Systems Ltd Sees Robust Trading Activity Amid Strong Buy Momentum
Apollo Micro Systems Ltd, a prominent player in the Aerospace & Defense sector, has witnessed significant trading activity with a strong uptick in value turnover and institutional interest. The stock’s recent performance highlights sustained investor confidence, supported by robust fundamentals and technical momentum, positioning it as a compelling small-cap opportunity in the current market environment.
Read full news article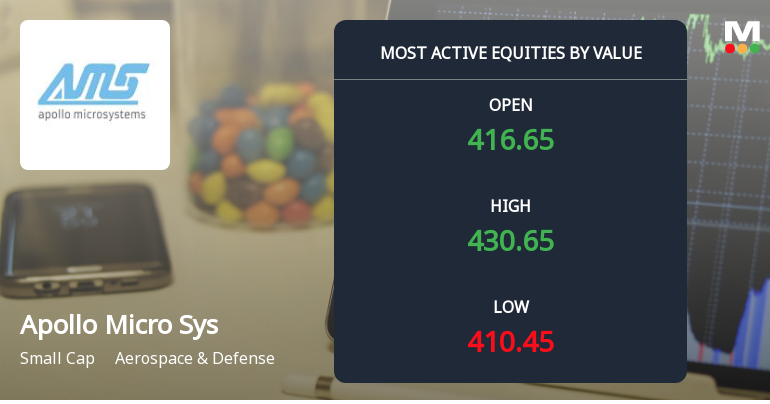
Apollo Micro Systems Ltd Sees Robust Trading Activity Amid Strong Buy Momentum
Apollo Micro Systems Ltd, a prominent player in the Aerospace & Defense sector, has witnessed significant trading activity with a notable surge in value turnover and institutional interest. The stock’s recent upgrade to a Strong Buy rating and its impressive market performance underscore growing investor confidence in this small-cap company.
Read full news article
Apollo Micro Systems Ltd is Rated Strong Buy
Apollo Micro Systems Ltd is rated Strong Buy by MarketsMOJO. This rating was last updated on 25 May 2026, reflecting a positive assessment of the stock’s prospects. However, all fundamentals, returns, and financial metrics discussed here are current as of 14 June 2026, providing investors with the latest insights into the company’s performance and outlook.
Read full news article Announcements
Apollo Micro Systems Limited - Other General Purpose
28-Nov-2019 | Source : NSEApollo Micro Systems Limited has submitted to the Exchange a copy of Disclosure of Related Party Transactions for the half year ended September 30, 2019 under Regulation 23(9) of Securities and Exchange Board of India (Listing Obligations and Disclosure Requirements) Regulations, 2015.
Apollo Micro Systems Limited - Press Release
18-Nov-2019 | Source : NSEApollo Micro Systems Limited has informed the Exchange regarding a press release dated November 16, 2019, titled "Newspaper Advertisement about publishing of Unaudited Financial Results
Apollo Micro Systems Limited - Outcome of Board Meeting
14-Nov-2019 | Source : NSEApollo Micro Systems Limited has informed the Exchange regarding Board meeting held on November 14, 2019.
Corporate Actions

No Upcoming Board Meetings

Apollo Micro Systems Ltd has declared 25% dividend, ex-date: 09 Sep 25

Apollo Micro Systems Ltd has announced 1:10 stock split, ex-date: 04 May 23

No Bonus history available

No Rights history available
Quality key factors
Valuation key factors
Technicals key factors
 Technical Indicator Scale: Bearish, Mildly Bearish, Sideways, Mildly Bullish, Bullish Turned
 Shareholding Snapshot : Mar 2026
Shareholding Compare (%holding)
Promoters
39.9202
Held by 8 Schemes (1.53%)
Held by 30 FIIs (3.63%)
Karunakar Reddy Baddam (47.28%)
None
34.62%
Quarterly Results Snapshot (Consolidated) - Mar'26 - YoY

YoY Growth in quarter ended Mar 2026 is 81.28% vs 19.44% in Mar 2025
YoY Growth in quarter ended Mar 2026 is 168.71% vs 8.19% in Mar 2025
Half Yearly Results Snapshot (Consolidated) - Sep'25

Growth in half year ended Sep 2025 is 42.45% vs 73.91% in Sep 2024
Growth in half year ended Sep 2025 is 105.64% vs 193.55% in Sep 2024
Nine Monthly Results Snapshot (Consolidated) - Dec'25
YoY Growth in nine months ended Dec 2025 is 52.65% vs 69.48% in Dec 2024
YoY Growth in nine months ended Dec 2025 is 77.64% vs 133.17% in Dec 2024
Annual Results Snapshot (Consolidated) - Mar'26
YoY Growth in year ended Mar 2026 is 60.89% vs 51.24% in Mar 2025
YoY Growth in year ended Mar 2026 is 100.21% vs 81.23% in Mar 2025
About Apollo Micro Systems Ltd

Company Coordinates


