
Compare Aptus Value Hou. with Similar Stocks
Dashboard
Strong Long Term Fundamental Strength with an average Return on Equity (ROE) of 16.01%
Healthy long term growth as Operating profit has grown by an annual rate of 28.19%
The company has declared Positive results for the last 18 consecutive quarters
With ROE of 18.6, it has a Attractive valuation with a 2.7 Price to Book Value
High Institutional Holdings at 59.78%
Consistent Underperformance against the benchmark over the last 3 years
Stock DNA
Housing Finance Company
INR 13,821 Cr (Small Cap)
14.00
12
1.65%
1.56
18.64%
2.69
Total Returns (Price + Dividend) 
Latest dividend: 2.5 per share ex-dividend date: May-15-2026
Risk Adjusted Returns v/s
Returns Beta

News

Aptus Value Housing Finance India Ltd is Rated Hold
Aptus Value Housing Finance India Ltd is rated 'Hold' by MarketsMOJO, with this rating last updated on 16 Apr 2026. However, the analysis and financial metrics discussed here reflect the stock’s current position as of 11 June 2026, providing investors with an up-to-date perspective on the company’s fundamentals, valuation, financial trends, and technical outlook.
Read full news article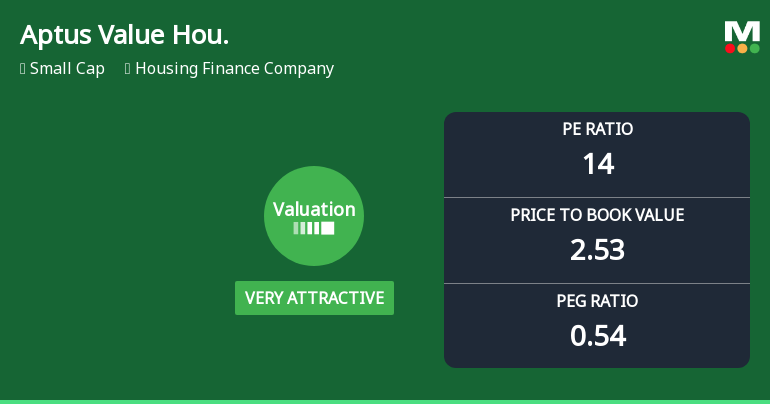
Aptus Value Housing Finance India Ltd: Valuation Shifts Signal Renewed Price Attractiveness
Aptus Value Housing Finance India Ltd has witnessed a significant improvement in its valuation parameters, shifting from an attractive to a very attractive rating. This change reflects a notable recalibration in price-to-earnings and price-to-book value metrics, positioning the small-cap housing finance company as a compelling option within its sector despite recent share price declines and mixed returns against the broader market.
Read full news article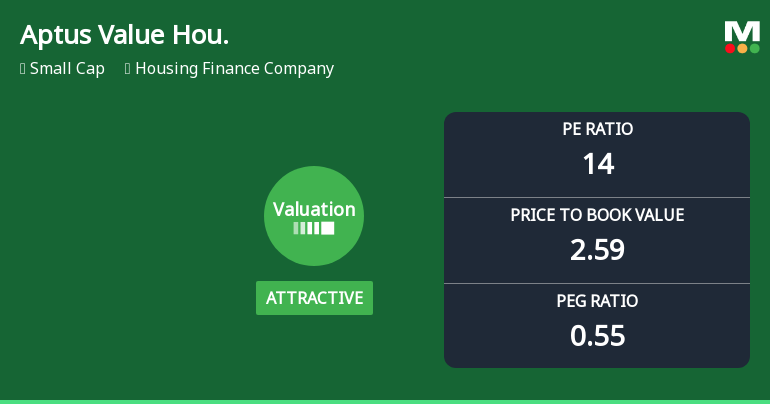
Aptus Value Housing Finance India Ltd: Valuation Shifts Signal Renewed Price Attractiveness
Aptus Value Housing Finance India Ltd has witnessed a notable shift in its valuation parameters, moving from a very attractive to an attractive grade, signalling a changing perception among investors. With a current P/E ratio of 13.91 and a P/BV of 2.59, the housing finance company’s valuation now reflects a more balanced risk-reward profile compared to its historical and peer averages.
Read full news article Announcements
Announcement under Regulation 30 (LODR)-Analyst / Investor Meet - Intimation
03-Jun-2026 | Source : BSEIntimation of investor/Analyst Meet
Announcement under Regulation 30 (LODR)-Analyst / Investor Meet - Intimation
01-Jun-2026 | Source : BSEIntimation of Investor/Analyst Meet
Compliances-Reg.24(A)-Annual Secretarial Compliance
29-May-2026 | Source : BSEIntimation of Annual Secretarial compliance report.
Corporate Actions

No Upcoming Board Meetings

Aptus Value Housing Finance India Ltd has declared 125% dividend, ex-date: 15 May 26

No Splits history available

No Bonus history available

No Rights history available
Quality key factors
Valuation key factors
Technicals key factors
 Technical Indicator Scale: Bearish, Mildly Bearish, Sideways, Mildly Bullish, Bullish Turned
 Shareholding Snapshot : Mar 2026
Shareholding Compare (%holding)
FIIs
None
Held by 21 Schemes (24.23%)
Held by 148 FIIs (30.34%)
Munuswamy Anandan (19.2%)
Sbi Long Term Advantage Fund-series Iv (9.39%)
10.72%
Quarterly Results Snapshot (Consolidated) - Mar'26 - QoQ

QoQ Growth in quarter ended Mar 2026 is 3.75% vs 1.76% in Dec 2025
QoQ Growth in quarter ended Mar 2026 is 10.48% vs 4.26% in Dec 2025
Half Yearly Results Snapshot (Consolidated) - Sep'25
Growth in half year ended Sep 2025 is 30.38% vs 27.71% in Sep 2024
Growth in half year ended Sep 2025 is 26.03% vs 21.85% in Sep 2024
Nine Monthly Results Snapshot (Consolidated) - Dec'25

YoY Growth in nine months ended Dec 2025 is 27.76% vs 27.84% in Dec 2024
YoY Growth in nine months ended Dec 2025 is 25.32% vs 21.51% in Dec 2024
Annual Results Snapshot (Consolidated) - Mar'26
YoY Growth in year ended Mar 2026 is 25.24% vs 28.22% in Mar 2025
YoY Growth in year ended Mar 2026 is 25.52% vs 22.77% in Mar 2025
About Aptus Value Housing Finance India Ltd

Company Coordinates


