
Compare Arigato Universe with Similar Stocks
Dashboard
Weak Long Term Fundamental Strength with an average Return on Equity (ROE) of 5.24%
- Poor long term growth as Operating profit has grown by an annual rate 19.63% of over the last 5 years
- Company's ability to service its debt is weak with a poor EBIT to Interest (avg) ratio of -0.58
Underperformed the market in the last 1 year
Stock DNA
Industrial Manufacturing
INR 29 Cr (Micro Cap)
13.00
37
0.00%
0.00
22.75%
3.01
Total Returns (Price + Dividend) 
Arigato Universe for the last several years.
Risk Adjusted Returns v/s
Returns Beta

News

Arigato Universe Ltd Downgraded to Sell Amid Mixed Financial and Technical Signals
Arigato Universe Ltd, a micro-cap player in the industrial manufacturing sector, has seen its investment rating downgraded from Hold to Sell as of 15 June 2026. This decision follows a comprehensive reassessment of the company’s quality, valuation, financial trends, and technical indicators, revealing a complex picture of strong recent earnings growth overshadowed by weak long-term fundamentals and deteriorating market momentum.
Read full news article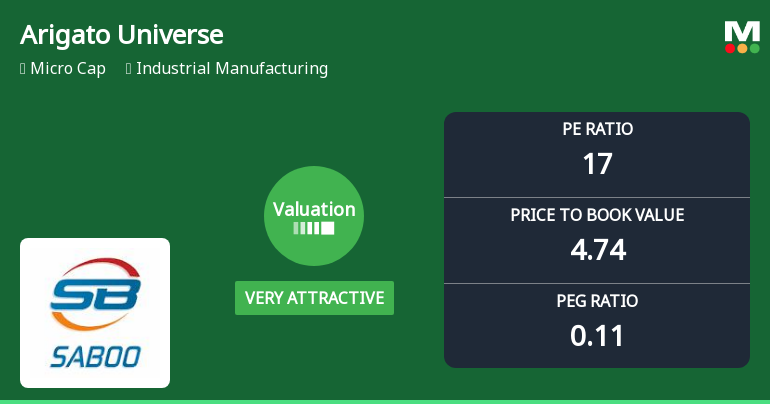
Arigato Universe Ltd Valuation Shifts Signal Renewed Price Attractiveness
Arigato Universe Ltd, a micro-cap player in the industrial manufacturing sector, has witnessed a significant shift in its valuation parameters, moving from an attractive to a very attractive price level. This change is underscored by a notable improvement in its price-to-earnings (P/E) and price-to-book value (P/BV) ratios relative to its historical averages and peer group, signalling a potential opportunity for investors amid mixed operational metrics.
Read full news articleAre Arigato Universe Ltd latest results good or bad?
The latest financial results for Arigato Universe Ltd for the quarter ended March 2026 indicate a complex operational landscape. The company reported net sales of ₹8.82 crores, reflecting a sequential growth of 39.34% from ₹6.33 crores in the previous quarter. This growth is notable, especially when compared to the erratic revenue patterns observed in prior quarters, which included periods of negligible sales. Net profit for the same quarter stood at ₹1.17 crores, marking a significant increase of 154.35% from ₹0.46 crores in the December 2025 quarter. However, this surge in profitability was heavily influenced by an extraordinary tax credit of ₹0.88 crores, which artificially inflated the profit figures. Without this adjustment, the normalized profit after tax would have been approximately ₹0.20 crores, suggesting that the underlying operational performance remains fragile. The company's operating margin...
Read full news article Announcements
Announcement under Regulation 30 (LODR)-Newspaper Publication
29-May-2026 | Source : BSEPublication of Audited Financial Result for the Quarter and year ended 31.03.2026.
Outcome Of Board Meeting Held Today I.E. 28Th May 2026
28-May-2026 | Source : BSEOutcome of Board Meeting held on 28th May2026 for approval of Financial Statement for quarter Half year and year ended 31.03.2026
Board Meeting Outcome for Outcome Of Board Meeting Held Today I.E. 28Th May 2026.
28-May-2026 | Source : BSEWe wish to inform you that in compliance with the provisions of Regulation 33 read with Regulation 30 of SEBI (Listing Obligations & Disclosure Requirements) Regulations 2015 the Board of Directors at their meeting held today i.e. 28th May 2026 have inter alia approved the following: 1. The Standalone Audited Financial Results set out in compliance with applicable Accounting Standards for the Quarter half year and year ended 31st March 2026 together with Statement of Assets and Liabilities. The Board Meeting commenced at 04:00 P.M. and concluded at 5.15 P.M. The aforesaid results are also being disseminated on companys website at Kindly take this intimation on your record.
Corporate Actions

No Upcoming Board Meetings

No Dividend history available

No Splits history available

No Bonus history available

No Rights history available
Quality key factors
Valuation key factors
Technicals key factors
 Technical Indicator Scale: Bearish, Mildly Bearish, Sideways, Mildly Bullish, Bullish Turned
 Shareholding Snapshot : Mar 2026
Shareholding Compare (%holding)
Promoters
None
Held by 0 Schemes
Held by 0 FIIs
Rajan Shah (50.71%)
Nivedita Bhorkar (3.2%)
24.72%
Quarterly Results Snapshot (Standalone) - Mar'26 - QoQ

QoQ Growth in quarter ended Mar 2026 is 39.34% vs -52.94% in Dec 2025
QoQ Growth in quarter ended Mar 2026 is 154.35% vs -24.59% in Dec 2025
Half Yearly Results Snapshot (Standalone) - Sep'25
Growth in half year ended Sep 2025 is 11,108.33% vs -79.66% in Sep 2024
Growth in half year ended Sep 2025 is 787.50% vs -166.67% in Sep 2024
Nine Monthly Results Snapshot (Standalone) - Dec'25
YoY Growth in nine months ended Dec 2025 is 16,383.33% vs -85.37% in Dec 2024
YoY Growth in nine months ended Dec 2025 is 129.97% vs -1,972.22% in Dec 2024
Annual Results Snapshot (Standalone) - Mar'26

YoY Growth in year ended Mar 2026 is 301.69% vs 318.82% in Mar 2025
YoY Growth in year ended Mar 2026 is 168.58% vs -1,479.17% in Mar 2025
About Arigato Universe Ltd

Company Coordinates


