
Compare Arrow Greentech with Similar Stocks
Dashboard
Negative results in Mar 26
- NET SALES(Q) At Rs 41.78 cr has Fallen at -27.07%
- PAT(Q) At Rs 7.40 cr has Fallen at -35.3%
- PBDIT(Q) Lowest at Rs 10.37 cr.
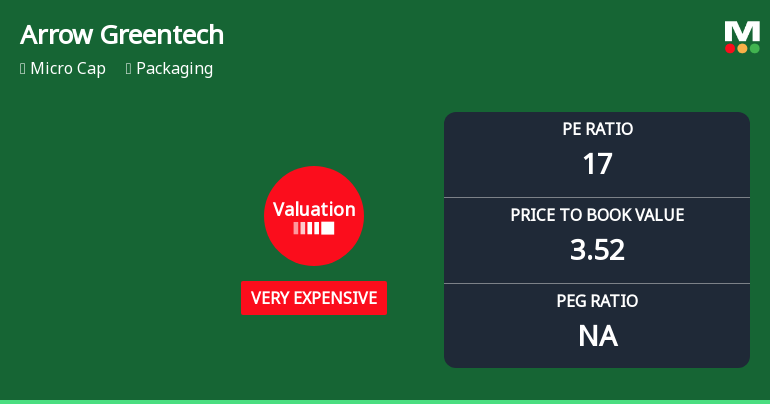
With ROE of 20.2, it has a Very Expensive valuation with a 3.5 Price to Book Value
Despite the size of the company, domestic mutual funds hold only 0% of the company
Underperformed the market in the last 1 year
Total Returns (Price + Dividend) 
Latest dividend: 4 per share ex-dividend date: Sep-18-2025
Risk Adjusted Returns v/s
Returns Beta

News
Arrow Greentech Ltd Valuation Shifts Signal Heightened Price Risk Amid Strong Returns
Arrow Greentech Ltd, a micro-cap player in the packaging sector, has seen its valuation parameters shift notably, with its price-to-earnings (P/E) and price-to-book value (P/BV) ratios moving into the 'very expensive' territory. Despite a recent uptick in share price and strong returns over longer periods, the company faces a downgrade in its overall mojo grade, reflecting growing concerns about its valuation relative to peers and historical benchmarks.
Read full news article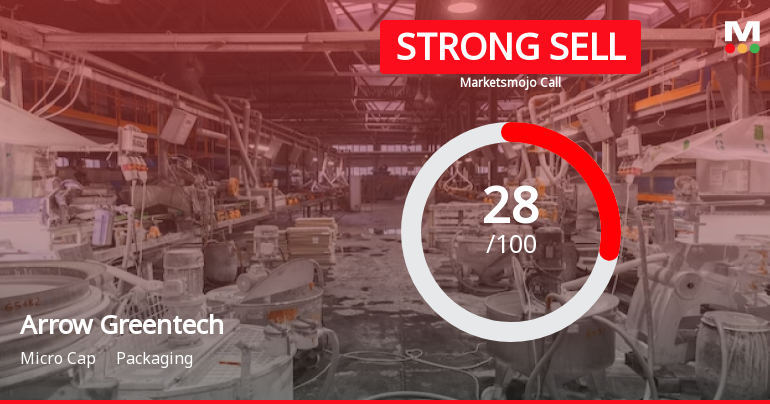
Arrow Greentech Ltd is Rated Strong Sell
Arrow Greentech Ltd is rated Strong Sell by MarketsMOJO, with this rating last updated on 22 May 2026. However, the analysis and financial metrics discussed here reflect the stock’s current position as of 24 May 2026, providing investors with the latest insights into its performance and outlook.
Read full news articleAre Arrow Greentech Ltd latest results good or bad?
Arrow Greentech Ltd's latest financial results for Q4 FY26 reveal significant operational challenges. The company reported net sales of ₹41.78 crores, reflecting a year-on-year decline of 27.07%, which is a marked contrast to the growth seen in previous quarters. This revenue contraction is accompanied by a net profit of ₹7.40 crores, down 35.31% compared to the same quarter last year. The operating margin also experienced compression, falling to 24.82%, the lowest level observed in recent quarters. This decline indicates potential difficulties in maintaining pricing power and managing costs effectively. The sharp sequential decline in both revenue and profitability from the prior quarter underscores the severity of the downturn. Despite these recent setbacks, Arrow Greentech's return on equity (ROE) remains a notable strength at 18.72%, which is above the average for its peers in the packaging sector. A...
Read full news article Announcements
Arrow Greentech Limited - Investor Presentation
27-Nov-2019 | Source : NSEArrow Greentech Limited has informed the Exchange regarding Investor Presentation
Arrow Greentech Limited - Updates
30-Oct-2019 | Source : NSEArrow Greentech Limited has informed the Exchange regarding 'Announcement Under Reg 30 SEBI (LODR) Regulation 2015- Update on Fire Accident in Ankleshwar Factory'.
Shareholders meeting
09-Sep-2019 | Source : NSE
| Voting Result of AGM |
Corporate Actions

No Upcoming Board Meetings

Arrow Greentech Ltd has declared 40% dividend, ex-date: 18 Sep 25

No Splits history available

No Bonus history available

Arrow Greentech Ltd has announced 1:5 rights issue, ex-date: 12 Feb 20
Quality key factors
Valuation key factors
Technicals key factors
 Technical Indicator Scale: Bearish, Mildly Bearish, Sideways, Mildly Bullish, Bullish Turned
 Shareholding Snapshot : Mar 2026
Shareholding Compare (%holding)
Promoters
None
Held by 0 Schemes
Held by 3 FIIs (0.07%)
Shilpan Pravin Patel (34.73%)
Ramesh Thakurdas Jaisinghani (1.23%)
27.72%
Quarterly Results Snapshot (Consolidated) - Mar'26 - YoY

YoY Growth in quarter ended Mar 2026 is -27.07% vs 13.18% in Mar 2025
YoY Growth in quarter ended Mar 2026 is -35.31% vs 12.93% in Mar 2025
Half Yearly Results Snapshot (Consolidated) - Sep'25
Growth in half year ended Sep 2025 is -21.60% vs 79.43% in Sep 2024
Growth in half year ended Sep 2025 is -31.38% vs 168.84% in Sep 2024
Nine Monthly Results Snapshot (Consolidated) - Dec'25
YoY Growth in nine months ended Dec 2025 is -14.69% vs 90.07% in Dec 2024
YoY Growth in nine months ended Dec 2025 is -22.70% vs 167.22% in Dec 2024
Annual Results Snapshot (Consolidated) - Mar'26
YoY Growth in year ended Mar 2026 is -17.60% vs 63.86% in Mar 2025
YoY Growth in year ended Mar 2026 is -25.00% vs 113.93% in Mar 2025
About Arrow Greentech Ltd

Company Coordinates


