
Compare Sh. Rama Multi. with Similar Stocks
Total Returns (Price + Dividend) 
Sh. Rama Multi. for the last several years.
Risk Adjusted Returns v/s
Returns Beta

News

Shree Rama Multi-Tech Ltd Faces Bearish Momentum Amid Technical Downgrade
Shree Rama Multi-Tech Ltd, a micro-cap player in the packaging sector, has seen a notable shift in its technical momentum, with key indicators signalling a bearish trend. Despite a strong long-term return profile, recent price action and technical parameters suggest caution for investors as the stock navigates a challenging phase.
Read full news article
Shree Rama Multi-Tech Ltd Upgraded to Sell on Technical Improvements Despite Financial Challenges
Shree Rama Multi-Tech Ltd, a micro-cap player in the packaging sector, has seen its investment rating upgraded from Strong Sell to Sell as of 13 July 2026. This change reflects a nuanced shift in the company’s technical outlook amid ongoing financial headwinds and valuation considerations. While the company’s long-term growth prospects remain intact, recent quarterly results and market dynamics have tempered enthusiasm, prompting a cautious stance from analysts.
Read full news article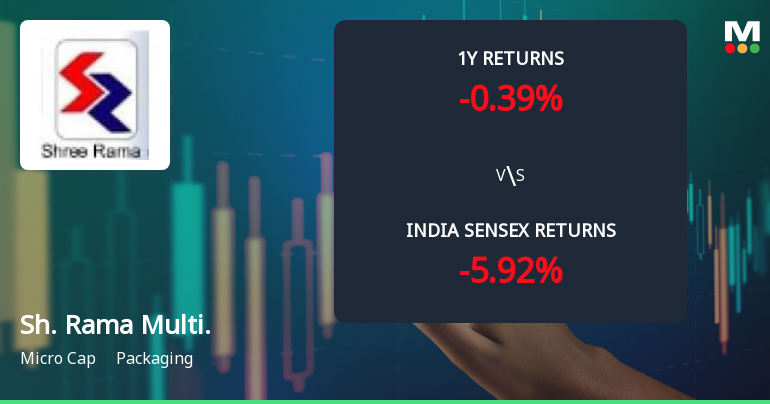
Shree Rama Multi-Tech Ltd Technical Momentum Shifts Amid Mixed Market Signals
Shree Rama Multi-Tech Ltd, a micro-cap player in the packaging sector, has experienced a subtle shift in its technical momentum, moving from a bearish stance to a mildly bearish outlook. Despite a recent downgrade in its Mojo Grade to Sell from Strong Sell, the stock’s mixed technical indicators suggest a complex interplay of bullish and bearish forces that investors should carefully analyse.
Read full news article Announcements
Shree Rama Multi-Tech Limited - Registrar & Share Transfer Agent Update
09-Dec-2019 | Source : NSEShree Rama Multi-Tech Limited has informed the Exchange regarding the Registrar & Share Transfer Agent Update
Shree Rama Multi-Tech Limited - Outcome of Board Meeting
13-Nov-2019 | Source : NSEShree Rama Multi-Tech Limited has informed the Exchange regarding Board meeting held on November 12, 2019.
Shree Rama Multi-Tech Limited - Shareholders meeting
26-Sep-2019 | Source : NSEShree Rama Multi-Tech Limited has informed the Exchange regarding Proceedings of Annual General Meeting held on September 25, 2019
Corporate Actions

No Upcoming Board Meetings

No Dividend history available

No Splits history available

No Bonus history available

Shree Rama Multi-Tech Ltd has announced 11:10 rights issue, ex-date: 30 May 23
Quality key factors
Valuation key factors
Technicals key factors
 Technical Indicator Scale: Bearish, Mildly Bearish, Sideways, Mildly Bullish, Bullish Turned
 Shareholding Snapshot : Mar 2026
Shareholding Compare (%holding)
Promoters
None
Held by 0 Schemes
Held by 0 FIIs
Nirma Chemical Works Private Limited (56.53%)
Jayesh H Patel (2.79%)
32.43%
Quarterly Results Snapshot (Standalone) - Mar'26 - QoQ

QoQ Growth in quarter ended Mar 2026 is 3.97% vs -3.50% in Dec 2025
QoQ Growth in quarter ended Mar 2026 is -14.65% vs -22.87% in Dec 2025
Half Yearly Results Snapshot (Standalone) - Sep'25
Growth in half year ended Sep 2025 is 22.58% vs 9.13% in Sep 2024

Growth in half year ended Sep 2025 is 53.00% vs 110.42% in Sep 2024
Nine Monthly Results Snapshot (Standalone) - Dec'25
YoY Growth in nine months ended Dec 2025 is 19.18% vs 13.23% in Dec 2024
YoY Growth in nine months ended Dec 2025 is 35.93% vs 122.81% in Dec 2024
Annual Results Snapshot (Standalone) - Mar'26
YoY Growth in year ended Mar 2026 is 15.63% vs 16.37% in Mar 2025
YoY Growth in year ended Mar 2026 is -51.78% vs 415.56% in Mar 2025
About Shree Rama Multi-Tech Ltd

Company Coordinates


