
Compare Pyramid Technopl with Similar Stocks
Dashboard
Strong ability to service debt as the company has a low Debt to EBITDA ratio of 3.28 times
Poor long term growth as Operating profit has grown by an annual rate -0.55% of over the last 5 years
Flat results in Mar 26
With ROCE of 9.7, it has a Attractive valuation with a 1.8 Enterprise value to Capital Employed
Despite the size of the company, domestic mutual funds hold only 0% of the company
Consistent Underperformance against the benchmark over the last 3 years
Total Returns (Price + Dividend) 
Latest dividend: 0.5 per share ex-dividend date: Sep-12-2025
Risk Adjusted Returns v/s
Returns Beta

News

Pyramid Technoplast Ltd is Rated Hold by MarketsMOJO
Pyramid Technoplast Ltd is rated 'Hold' by MarketsMOJO, with this rating last updated on 08 June 2026. However, the analysis and financial metrics discussed below reflect the company’s current position as of 02 July 2026, providing investors with an up-to-date view of its fundamentals, valuation, financial trends, and technical outlook.
Read full news article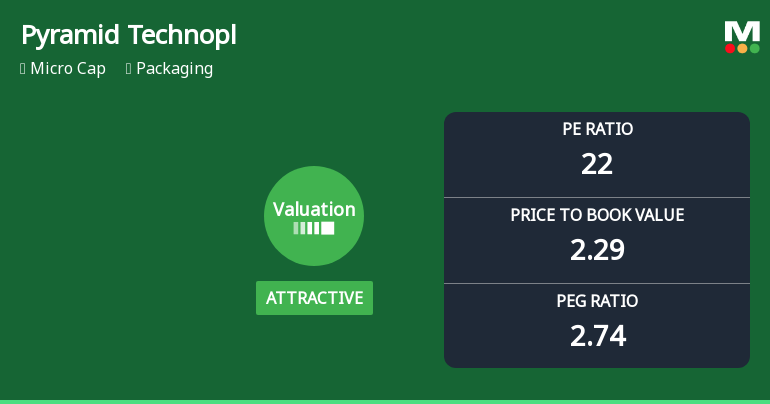
Pyramid Technoplast Ltd Valuation Shifts Signal Renewed Price Attractiveness
Pyramid Technoplast Ltd has witnessed a notable improvement in its valuation parameters, shifting from a very attractive to an attractive grade, reflecting growing investor confidence. With a current price of ₹172.00 and a market cap categorised as micro-cap, the packaging sector company’s price-to-earnings (P/E) ratio now stands at 21.95, signalling a more balanced valuation relative to its historical and peer averages.
Read full news article
Pyramid Technoplast Ltd Technical Momentum Shifts Amid Mixed Market Signals
Pyramid Technoplast Ltd, a micro-cap player in the packaging sector, has witnessed a nuanced shift in its technical momentum, reflecting a transition from a bullish to a mildly bullish trend. Despite a recent dip in price, the stock’s technical indicators present a complex picture, with mixed signals from MACD, RSI, moving averages, and other momentum oscillators. This analysis delves into the evolving technical landscape of Pyramid Technoplast, contextualising its price action against broader market movements and sectoral trends.
Read full news article Announcements
Corporate Actions

No Upcoming Board Meetings

Pyramid Technoplast Ltd has declared 5% dividend, ex-date: 12 Sep 25

No Splits history available

No Bonus history available

No Rights history available
Quality key factors
Valuation key factors
Technicals key factors
 Technical Indicator Scale: Bearish, Mildly Bearish, Sideways, Mildly Bullish, Bullish Turned
 Shareholding Snapshot : Mar 2026
Shareholding Compare (%holding)
Promoters
None
Held by 0 Schemes
Held by 4 FIIs (0.97%)
Yash Synthetics Llp (27.57%)
Carnelian Structural Shift Fund (2.68%)
17.57%
Quarterly Results Snapshot (Standalone) - Mar'26 - QoQ

QoQ Growth in quarter ended Mar 2026 is 20.62% vs 0.42% in Dec 2025
QoQ Growth in quarter ended Mar 2026 is 111.39% vs -22.93% in Dec 2025
Half Yearly Results Snapshot (Standalone) - Sep'25
Growth in half year ended Sep 2025 is 21.69% vs -1.36% in Sep 2024
Growth in half year ended Sep 2025 is 5.95% vs -14.99% in Sep 2024
Nine Monthly Results Snapshot (Standalone) - Dec'25
YoY Growth in nine months ended Dec 2025 is 15.71% vs 5.35% in Dec 2024
YoY Growth in nine months ended Dec 2025 is -6.28% vs -9.02% in Dec 2024
Annual Results Snapshot (Standalone) - Mar'26
YoY Growth in year ended Mar 2026 is 15.15% vs 11.07% in Mar 2025
YoY Growth in year ended Mar 2026 is 8.06% vs -9.10% in Mar 2025
About Pyramid Technoplast Ltd

Company Coordinates


