
Compare Aryaman Capital with Similar Stocks
Stock DNA
Non Banking Financial Company (NBFC)
INR 498 Cr (Micro Cap)
17.00
21
0.00%
0.00
25.71%
4.61
Total Returns (Price + Dividend) 
Aryaman Capital for the last several years.
Risk Adjusted Returns v/s
Returns Beta

News

Aryaman Capital Markets Ltd is Rated Strong Sell
Aryaman Capital Markets Ltd is rated Strong Sell by MarketsMOJO. This rating was last updated on 12 February 2026. However, the analysis and financial metrics presented here reflect the stock’s current position as of 21 June 2026, providing investors with the latest insights into the company’s performance and outlook.
Read full news article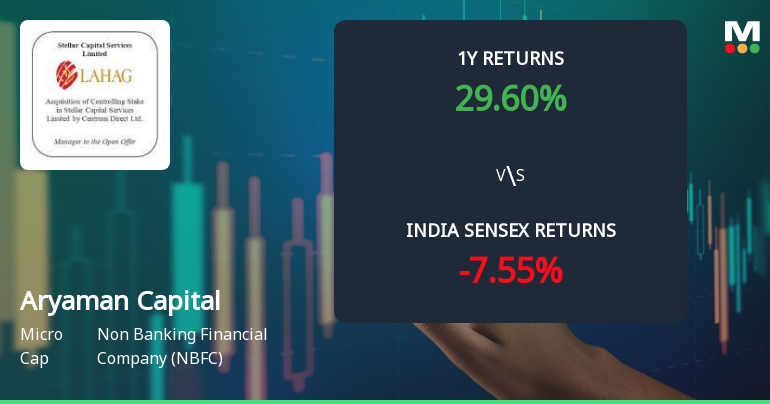
Aryaman Capital Markets Ltd Technical Momentum Shifts Amid Mixed Signals
Aryaman Capital Markets Ltd, a micro-cap player in the Non Banking Financial Company (NBFC) sector, has exhibited a notable shift in its technical momentum, moving from a bearish stance to a mildly bearish outlook. Despite a strong day gain of 5.18%, the stock’s technical indicators present a complex picture, with mixed signals across weekly and monthly timeframes, challenging investors to carefully analyse the evolving trend dynamics.
Read full news article
Aryaman Capital Markets Ltd is Rated Strong Sell
Aryaman Capital Markets Ltd is rated Strong Sell by MarketsMOJO. This rating was last updated on 12 February 2026. However, the analysis and financial metrics presented here reflect the stock’s current position as of 10 June 2026, providing investors with the latest insights into the company’s performance and outlook.
Read full news article Announcements
Closure of Trading Window
25-Jun-2026 | Source : BSEIntimation for the closure of the trading window
Compliances-Reg.24(A)-Annual Secretarial Compliance
23-May-2026 | Source : BSECompliance under Regulation 24(A) of the Securities and Exchange Board of India (Listing Obligations and Disclosure Requirements) Regulations 2015
Announcement under Regulation 30 (LODR)-Newspaper Publication
20-May-2026 | Source : BSENewspaper Advertisement under Regulation 47 read with Regulation 33 of the SEBI (Listing Obligations and Disclosure Requirements) Regulations 2015
Corporate Actions

No Upcoming Board Meetings

No Dividend history available

No Splits history available

No Bonus history available

No Rights history available
Quality key factors
Valuation key factors
Technicals key factors
 Technical Indicator Scale: Bearish, Mildly Bearish, Sideways, Mildly Bullish, Bullish Turned
 Shareholding Snapshot : Dec 2025
Shareholding Compare (%holding)
Promoters
None
Held by 0 Schemes
Held by 0 FIIs
Aryaman Financial Services Limited (74.28%)
Stellar Capital Services Limited (3.84%)
8.06%
Quarterly Results Snapshot (Standalone) - Mar'26 - YoY
Not Applicable: The company has declared_date for only one period
Not Applicable: The company has declared_date for only one period
Half Yearly Results Snapshot (Standalone) - Sep'25

Growth in half year ended Sep 2025 is -28.10% vs 106.83% in Mar 2025
Growth in half year ended Sep 2025 is 4.41% vs 186.20% in Mar 2025
Nine Monthly Results Snapshot (Standalone) - Dec'25
YoY Growth in nine months ended Dec 2025 is 7.23% vs 78.25% in Dec 2024
YoY Growth in nine months ended Dec 2025 is 34.17% vs 147.88% in Dec 2024
Annual Results Snapshot (Standalone) - Mar'26
YoY Growth in year ended Mar 2026 is -20.79% vs 133.90% in Mar 2025
YoY Growth in year ended Mar 2026 is 21.19% vs 254.95% in Mar 2025
About Aryaman Capital Markets Ltd

Company Coordinates


