
Compare Aryavan Enterpri with Similar Stocks
Dashboard
Weak Long Term Fundamental Strength with an average Return on Equity (ROE) of 5.09%
- Company's ability to service its debt is weak with a poor EBIT to Interest (avg) ratio of 1.02
With a growth in Operating Profit of 97.89%, the company declared Very Positive results in Mar 26
With ROE of 10.6, it has a Attractive valuation with a 1.2 Price to Book Value
Majority shareholders : Non Institution
Market Beating Performance
Stock DNA
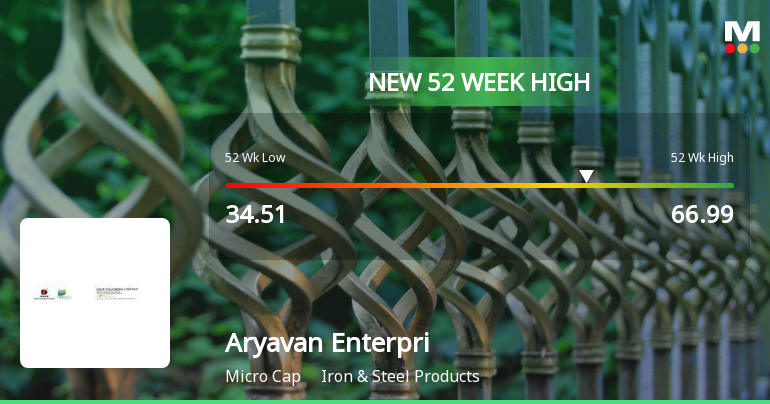
Iron & Steel Products
INR 42 Cr (Micro Cap)
13.00
24
0.89%
0.08
10.60%
1.23
Total Returns (Price + Dividend) 
Latest dividend: 0.5 per share ex-dividend date: Nov-28-2025
Risk Adjusted Returns v/s
Returns Beta

News
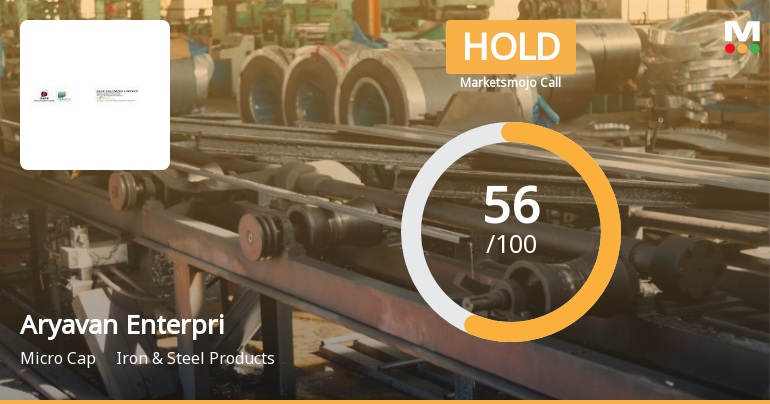
Aryavan Enterprise Ltd Upgraded to Hold: Comprehensive Analysis of Quality, Valuation, Financial Trend, and Technicals
Aryavan Enterprise Ltd, a micro-cap player in the Iron & Steel Products sector, has seen its investment rating upgraded from Sell to Hold as of 6 July 2026. This shift reflects improvements across multiple key parameters including valuation, technical indicators, and financial performance, signalling a more favourable outlook for investors after a period of sideways movement and valuation reassessment.
Read full news article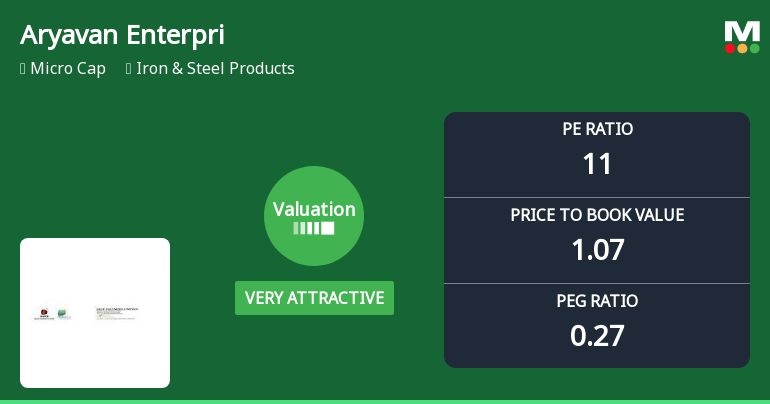
Aryavan Enterprise Ltd Valuation Shifts to Very Attractive Amid Sector Challenges
Aryavan Enterprise Ltd, a micro-cap player in the Iron & Steel Products sector, has seen a marked improvement in its valuation parameters, shifting from an 'attractive' to a 'very attractive' rating. This change reflects a significant reappraisal of the stock’s price metrics, notably its price-to-earnings (P/E) and price-to-book value (P/BV) ratios, positioning it as a compelling consideration for value-focused investors amid a challenging sector backdrop.
Read full news article Announcements
Closure of Trading Window
30-Jun-2026 | Source : BSETrading Window Closure for Declaration of Financial Results for First Quarter ended 30th June 2026.
RESULTS - Financial Results For Quarter And Year Ended 31/0/2026.
30-May-2026 | Source : BSEThe Company at its meeting held today inter alia approved Audited Financial Results for Quarter and Year ended 31st March 2026.
Board Meeting Outcome for Outcome Of Board Meeting Pursuant To Regulation 30 And 33 Of SEBI (Listing Obligations And Disclosure Requirements) Regulations 2015 As Amended (SEBI Listing Regulations).
30-May-2026 | Source : BSEThe Company at its meeting held today has inter-alia discussed approved and taken on record the following matter: 1. Approved Audited Financial Results (Standalone and Consolidated) of the Company for the Quarter and Year ended on 31st March 2026 and; 2. Took on record Auditors Report thereon issued by Statutory Auditors of the Company M/s. S N D K & Associates LLP Chartered Accountants (FRN: W100060).
Corporate Actions

No Upcoming Board Meetings

Aryavan Enterprise Ltd has declared 5% dividend, ex-date: 28 Nov 25

No Splits history available

No Bonus history available

No Rights history available
Quality key factors
Valuation key factors
Technicals key factors
 Technical Indicator Scale: Bearish, Mildly Bearish, Sideways, Mildly Bullish, Bullish Turned
 Shareholding Snapshot : Mar 2026
Shareholding Compare (%holding)
Non Institution
None
Held by 0 Schemes
Held by 0 FIIs
Prafullchandra Vitthalbhai Patel (23.38%)
Gaurav Pachouri (2.73%)
52.14%
Quarterly Results Snapshot (Standalone) - Mar'26 - YoY

YoY Growth in quarter ended Mar 2026 is 10.24% vs 143.11% in Mar 2025
YoY Growth in quarter ended Mar 2026 is 80.77% vs 420.00% in Mar 2025
Half Yearly Results Snapshot (Consolidated) - Sep'25
Not Applicable: The company has declared_date for only one period
Not Applicable: The company has declared_date for only one period
Nine Monthly Results Snapshot (Consolidated) - Dec'25
Not Applicable: The company has declared_date for only one period
Not Applicable: The company has declared_date for only one period
Annual Results Snapshot (Consolidated) - Mar'26
YoY Growth in year ended Mar 2026 is 53.07% vs 450.84% in Mar 2025
YoY Growth in year ended Mar 2026 is 149.63% vs 400.00% in Mar 2025
About Aryavan Enterprise Ltd

Company Coordinates


