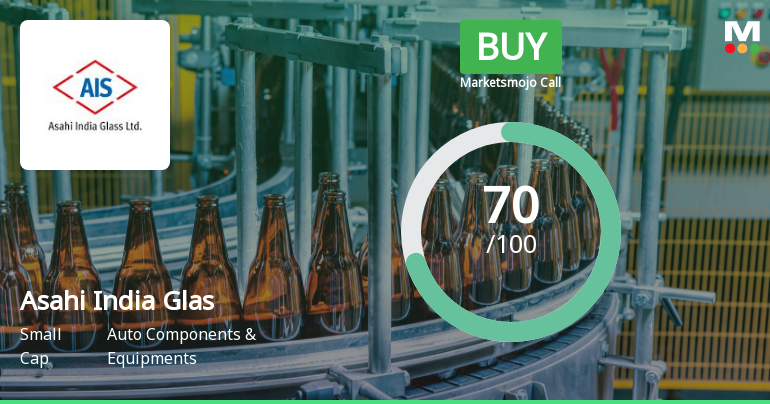
Asahi India Glas

  • Market Cap: Small Cap
  • Industry: Auto Components & Equipments
  • ISIN: INE439A01020
  • NSEID: ASAHIINDIA
  • BSEID: 515030
INR
914.80
23.1 (2.59%)
BSENSE

May 27

BSE+NSE Vol: 11.4 lacs

  • Price Points
  • Score
  • Mojo Parameters
  • Total Return
  • News and Corporate Actions
  • Key factors
  • Shareholding
  • Financials
  • CompanyCV
stock-summaryPrice Point
High/Low

1Day

52 Week

Valuation
Technical
Day's Volume

CASH

11.4 lacs (238.68%) Volume

Shareholding (Mar 2026)

FII

4.85%

Held by 109 FIIs

DII

5.36%

Held by 14 DIIs

Promoter

51.57%

What does Asahi India Glas do?

06-Jun-2025

Asahi India Glass Ltd is a leading manufacturer of glass products for the automotive industry, incorporated in 1984. As of March 2025, it reported net sales of ₹1,180 Cr and a net profit of ₹92 Cr, with a market cap of ₹18,350 Cr.

Overview: <BR>Asahi India Glass Ltd is a leading integrated glass solutions provider in the Auto Components & Equipments industry, focusing on manufacturing a wide range of glass products.<BR><BR>History: <BR>Asahi India Glass Ltd was incorporated in 1984 as Indian Auto Safety Glasses. It was promoted as a Joint Venture by Maruti Udyog, Asahi Glass Company, Japan, and B M Labroo and Associates. The latest quarterly results report net sales and profit for the period ending March 2025.<BR><BR>Financial Snapshot: <BR>Most recent Net Sales: 1,180 Cr (Quarterly Results - Mar 2025) <BR>Most recent Net Profit: 92 Cr (Quarterly Results - Mar 2025) <BR>Market-cap value: Rs 18,350 Cr (Mid Cap)<BR><BR>Key Metrics: <BR>P/E: 51.00 <BR>Industry P/E: 41 <BR>Dividend Yield: 0.27% <BR>Debt-Equity: 0.95 <BR>Return on Equity: 13.02% <BR>Price to Book: 6.70 <BR><BR>Contact Details: <BR>Address: Unit 203 to 208 Ishwar Nagar, Tribhuwan Complex Mathura Road New Delhi New Delhi : 110065 <BR>Tel: 91-011-49454900 <BR>Email: investorrelations@aisglass.com <BR>Website: http://www.aisglass.com

View full answer

Has Asahi India Glas declared dividend?

06-Jun-2025

Asahi India Glass Ltd has declared a 200% dividend, amounting to ₹2 per share, with an ex-date of August 28, 2024. While recent returns show some volatility, the company has demonstrated strong growth over the past five years, with a total return of 302.75%.

Asahi India Glass Ltd has declared a 200% dividend.<BR><BR>Dividend Details:<BR>- Percentage announced: 200%<BR>- Amount per share: 2 per share<BR>- Ex-date: 28 Aug 24<BR><BR>Dividend Yield: 0.27%.<BR><BR>Total Returns by Period:<BR>Over the last 6 months, the price return was -1.53%, with a dividend return of 0%, resulting in a total return of -1.53%.<BR><BR>In the past year, the price return was 24.37%, the dividend return was 0.32%, leading to a total return of 24.69%.<BR><BR>Over the last 2 years, the price return was 56.69%, with a dividend return of 0.82%, resulting in a total return of 57.51%.<BR><BR>In the 3-year period, the price return was 60.48%, the dividend return was 1.21%, culminating in a total return of 61.69%.<BR><BR>For the 4-year period, the price return was 123.48%, with a dividend return of 2.18%, leading to a total return of 125.66%.<BR><BR>Over the last 5 years, the price return was 298.76%, the dividend return was 3.99%, resulting in a total return of 302.75%.<BR><BR>Overall, Asahi India Glass Ltd has declared a significant dividend, and while the recent returns over shorter periods show some volatility, the longer-term returns indicate strong growth, particularly over the 5-year period.

View full answer

Is Asahi India Glas overvalued or undervalued?

01-Jul-2025

As of June 30, 2025, Asahi India Glas is considered very expensive with a PE ratio of 53.02 and a PEG ratio of 8.87, indicating overvaluation despite a 13.07% return over the past year, especially when compared to peers like Borosil and La Opala RG.

As of 30 June 2025, the valuation grade for Asahi India Glas has moved from expensive to very expensive. The company is currently overvalued, with a PE ratio of 53.02, a Price to Book Value of 6.90, and an EV to EBITDA of 27.36. In comparison to peers, Borosil has a PE of 55.04, while La Opala RG shows a significantly lower PE of 29.96, indicating that Asahi India Glas is trading at a premium relative to some competitors despite its high valuation grade.<BR><BR>The company's financial metrics reflect a challenging valuation scenario, particularly with a PEG ratio of 8.87, suggesting limited growth prospects relative to its price. Additionally, while the stock has outperformed the Sensex over the past year with a return of 13.07% compared to the Sensex's 5.79%, the overall high valuation metrics indicate that the stock may not be a sustainable investment at current levels.

View full answer

Who are the peers of the Asahi India Glas?

16-Jul-2025

Peers of Asahi India Glas include Exide Industries, Motherson Wiring, Sona BLW Precision, ZF Commercial, Sundram Fasteners, Amara Raja Batteries, HBL Engineering, CIE Automotive, JBM Auto, and Gabriel India. Most peers show below-average growth, with JBM Auto exhibiting excellent growth, while Asahi India Glas has average management risk and a below-average capital structure.

Peers: The peers of Asahi India Glas are Exide Inds., Motherson Wiring, Sona BLW Precis., ZF Commercial, Sundram Fasten., Amara Raja Ener., HBL Engineering, CIE Automotive, JBM Auto, and Gabriel India.<BR><BR>Quality Snapshot: Excellent management risk is observed at Motherson Wiring and Amara Raja Ener., while Good management risk is found at Exide Inds., Sona BLW Precis., ZF Commercial, Sundram Fasten., and Gabriel India. Average management risk is present at Asahi India Glas, HBL Engineering, CIE Automotive, and JBM Auto. All peers exhibit Below Average growth except for JBM Auto, which has Excellent growth, while ZF Commercial stands out with Good growth. Excellent capital structure is noted for Exide Inds., Motherson Wiring, Sona BLW Precis., ZF Commercial, Sundram Fasten., Amara Raja Ener., HBL Engineering, CIE Automotive, and Gabriel India, while Asahi India Glas, and JBM Auto have Average and Below Average capital structure, respectively.<BR><BR>Return Snapshot: Gabriel India has the highest 1-year return at 111.49%, while Sona BLW Precis. has the lowest at -36.24%. Asahi India Glas's 1-year return of 31.11% is significantly higher than Sona BLW Precis. Additionally, the peers with negative six-month returns include Exide Inds., Sona BLW Precis., Sundram Fasten., Amara Raja Ener., CIE Automotive, and JBM Auto.

View full answer

Who are in the management team of Asahi India Glas?

16-Jul-2025

As of March 2023, the management team of Asahi India Glas includes Sanjay Labroo (CMD & CEO), Satoshi Ogata and Masao Fukami (Deputy Managing Directors), along with several independent and non-executive directors, ensuring a diverse governance structure.

As of March 2023, the management team of Asahi India Glas includes the following individuals:<BR><BR>1. Sanjay Labroo - CMD & CEO<BR>2. Rahul Rana - Independent Director<BR>3. Gopal Ganatra - Company Secretary & Compliance Officer<BR>4. Gurvirendra Singh Talwar - Independent Director<BR>5. Shradha Suri - Independent Director<BR>6. M Takeda - Non-Executive Director<BR>7. Satoshi Ogata - Deputy Managing Director<BR>8. Yoji Taguchi - Independent Director<BR>9. Sheetal Mehta - Independent Director<BR>10. Masao Fukami - Deputy Managing Director<BR>11. N Labroo - Non-Executive Director<BR>12. Satoshi Ishizuka - Non-Executive Director<BR><BR>This team comprises a mix of executive and independent directors, contributing to the governance and strategic direction of the company.

View full answer

Who are the top shareholders of the Asahi India Glas?

17-Jul-2025

The top shareholders of Asahi India Glas include Asahi Glass Co., Ltd with 22.21%, mutual funds holding 1.59%, Foreign Institutional Investors at 4.16%, and individual investor Nemish S Shah with 4.57%. Overall, individual investors own 19.57% of the company.

The top shareholders of Asahi India Glas include the promoters, with Asahi Glass Co., Ltd holding the largest stake at 22.21%. Additionally, there are mutual funds involved, represented by 21 schemes that collectively hold 1.59% of the shares. Foreign Institutional Investors (FIIs) have a presence as well, holding 4.16% through 96 different entities. The highest public shareholder is Nemish S Shah, who owns 4.57%. Individual investors collectively hold 19.57% of the company.

View full answer

How big is Asahi India Glas?

24-Jul-2025

As of 24th July, Asahi India Glass Ltd has a market capitalization of 20,711.00 Cr, with recent net sales of 4,594.49 Cr and a net profit of 371.28 Cr over the latest four quarters.

As of 24th July, <BR><BR>Market Cap: Asahi India Glass Ltd has a market capitalization of 20,711.00 Cr and is classified as a Large Cap company.<BR><BR>Recent Quarterly Performance: The sum of Net Sales for the latest 4 quarters is 4,594.49 Cr, while the sum of Net Profit for the same period is 371.28 Cr.<BR><BR>Balance Sheet Snapshot: The reporting period for the latest annual data is March 2024. Shareholder's Funds stand at 2,353.45 Cr, and Total Assets are valued at 5,499.61 Cr.

View full answer

Is Asahi India Glas technically bullish or bearish?

16-Oct-2025

As of 15 October 2025, the technical trend for Asahi India Glas has shifted to bullish, supported by strong indicators like a bullish MACD and Bollinger Bands, despite some mildly bearish signals from the KST and Dow Theory.

As of 15 October 2025, the technical trend has changed from mildly bullish to bullish. The current stance is bullish with strong indicators supporting this outlook. The MACD is bullish on both the weekly and monthly time frames, and Bollinger Bands also indicate a bullish trend on both time frames. Daily moving averages confirm a bullish sentiment. However, the KST shows a mildly bearish signal on the weekly and monthly, and Dow Theory indicates a mildly bullish stance on the weekly with no trend on the monthly. Overall, the bullish indicators outweigh the bearish signals, suggesting a strong bullish momentum for Asahi India Glas.

View full answer

How has been the historical performance of Asahi India Glas?

06-Nov-2025

Asahi India Glas has shown consistent growth in net sales and profits, with net sales increasing from 2,434.34 crore in March 2021 to 4,594.48 crore in March 2025, and profit after tax rising from 121.25 crore to 364.66 crore during the same period. The company has also seen significant growth in total assets and improved cash flow from operating activities.

Answer:<BR>The historical performance of Asahi India Glas shows a consistent growth trajectory in net sales and profits over the years, with the most recent figures for March 2025 indicating net sales of 4,594.48 crore and a profit after tax of 364.66 crore.<BR><BR>Breakdown:<BR>Asahi India Glas has demonstrated significant growth in net sales, increasing from 2,434.34 crore in March 2021 to 4,594.48 crore in March 2025. The total operating income followed a similar trend, reaching 4,594.48 crore in March 2025. Despite fluctuations in operating profit, which peaked at 811.24 crore in March 2023 before settling at 798.12 crore in March 2025, the company maintained a healthy profit before tax of 510.13 crore in the latest fiscal year. The profit after tax also showed an upward trend, rising from 121.25 crore in March 2021 to 364.66 crore in March 2025. On the balance sheet, total assets increased significantly from 3,721.90 crore in March 2021 to 6,789.80 crore in March 2025, while total liabilities also rose, indicating a growing leverage from 1,878.54 crore to 2,530.48 crore during the same period. Cash flow from operating activities improved to 719.00 crore in March 2025, although the company experienced a net cash outflow of 13.00 crore in the same year. Overall, Asahi India Glas has shown resilience and growth in its financial performance over the years.

View full answer

Are Asahi India Glass Ltd latest results good or bad?

30-Jan-2026

Asahi India Glass Ltd's latest Q3 FY26 results show a slight QoQ net profit increase of 0.68% to ₹56.55 crore, but a significant 40.77% decline year-on-year, alongside declining net sales and operating margins, indicating substantial profitability pressures and challenges in demand. Investors should be cautious due to rising costs and increased debt from capacity expansion.

Asahi India Glass Ltd's latest results for Q3 FY26 present a mixed picture. On one hand, the company reported a net profit of ₹56.55 crore, which is a slight increase of 0.68% compared to the previous quarter. However, this figure represents a significant decline of 40.77% year-on-year, indicating substantial profitability pressure.<BR><BR>Net sales for the quarter were ₹1,151.22 crore, reflecting a decline of 6.31% from the previous quarter and a marginal decrease of 0.56% compared to the same quarter last year. This stagnation in revenue suggests challenges in demand, particularly in the automotive glass segment, which is a core area for the company.<BR><BR>Operationally, the operating margin (excluding other income) stood at 16.49%, down from 18.42% a year ago, indicating rising cost pressures. The profit after tax (PAT) margin also decreased to 5.10%, down from 8.20% in the same quarter last year.<BR><BR>The company's financial health is further complicated by a significant increase in interest expenses, which nearly doubled year-on-year, reflecting the impact of its aggressive capacity expansion funded through debt. This has led to concerns about the sustainability of its profitability and the overall debt burden.<BR><BR>In summary, while there are some positive signs, such as a slight QoQ increase in net profit, the overall performance shows significant challenges, particularly in terms of year-on-year comparisons and margin pressures. Investors should approach with caution, keeping an eye on the company's ability to navigate these operational headwinds.

View full answer

When is the next results date for Asahi India Glass Ltd?

21-May-2026

The next results date for Asahi India Glass Ltd is 27 May 2026.

The next results date for Asahi India Glass Ltd is scheduled for 27 May 2026.

View full answer

Should I buy, sell or hold Asahi India Glass Ltd?

27-May-2026

Why is Asahi India Glass Ltd falling/rising?

27-May-2026

As of 26-May, Asahi India Glass Ltd's stock price is rising to Rs 891.70, up 4.51%, due to a trend reversal and strong financial performance, despite a year-to-date decline. The stock has outperformed its sector and shows resilience with a 22.20% increase over the past year.

As of 26-May, Asahi India Glass Ltd's stock price is rising, currently at Rs 891.70, reflecting an increase of Rs 38.5 or 4.51%. This upward movement can be attributed to several factors. Firstly, the stock has shown a trend reversal, gaining after two consecutive days of decline. Additionally, it outperformed its sector by 0.8% today, indicating stronger performance relative to its peers.<BR><BR>The stock also reached an intraday high of Rs 896.95, which is a significant increase of 5.13%. Furthermore, the glass sector itself has seen a gain of 3.86%, contributing to the positive sentiment surrounding Asahi India Glass Ltd. <BR><BR>Despite a year-to-date decline of 11.97%, the stock has demonstrated resilience with a 22.20% increase over the past year, significantly outperforming the broader market, which has seen a negative return of 7.50%. The company's strong financial performance, highlighted by a high return on capital employed (ROCE) of 16.27% and record net sales of Rs 1,255.91 crore, also supports the stock's rising price.<BR><BR>However, it is important to note that there has been a decline in investor participation, with delivery volume falling by 39.38% compared to the 5-day average. Despite this, the liquidity remains adequate for trading, which may help sustain the stock's upward momentum. Overall, the combination of positive sector performance, strong financial results, and a recent trend reversal contributes to the rising stock price of Asahi India Glass Ltd.

View full answer
iScoreScore
Click here to find our call on this stock
Strong Sell
Sell
Hold
Buy
Strong Buy

Dashboard

1

High Management Efficiency with a high ROCE of 16.27%

 
2

The company has declared positive results in Dec'2025 after 2 consecutive negative quarters

3

With ROCE of 9.2, it has a Very Expensive valuation with a 4.6 Enterprise value to Capital Employed

4

Majority shareholders : Promoters

 
5

Market Beating performance in long term as well as near term

6

With its market cap of Rs 22,765 cr, it is the biggest company in the sector and constitutes 59.92% of the entire sector

stock-summaryMojo Parameters

Mojo Parameters

Loading Valuation Snapshot...

Stock DNA

stock-summary
Industry

Auto Components & Equipments

stock-summary
Market cap

INR 22,937 Cr (Small Cap)

stock-summary
P/E

75.00

stock-summary
Industry P/E

38

stock-summary
Dividend Yield

0.21%

stock-summary
Debt Equity

0.52

stock-summary
Return on Equity

7.75%

stock-summary
Price to Book

6.15

Revenue and Profits:
Net Sales:
1,256 Cr
(Quarterly Results - Dec 2025)
Net Profit:
100 Cr
stock-summaryTotal Returns
Total Returns (Price + Dividend) stock-summary
Dividend Yield (0.21%)
TimePeriod
Price Return
Dividend Return
Total Return
3 Months
0.65%
0%
0.65%
6 Months
-10.57%
0%
-10.57%
1 Year
22.96%
0.27%
23.23%
2 Years
53.88%
0.68%
54.56%
3 Years
100.44%
1.28%
101.72%
4 Years
103.79%
1.73%
105.52%
5 Years
186.41%
2.77%
189.18%

Latest dividend: 2 per share ex-dividend date: Sep-03-2025

Risk Adjusted Returns v/s stock-summary
Returns Beta
Icon
Beta has not been calculated since enough price history is not available
stock-summaryNews & Corporate Actions

Announcements stock-summary

Board Meeting Intimation for Intimation Of Board Meeting

20-May-2026 | Source : BSE

Asahi India Glass Ltdhas informed BSE that the meeting of the Board of Directors of the Company is scheduled on 27/05/2026 inter alia to consider and approve and take on record the Audited Financial Results of the Company for the fourth quarter and year ended 31st March 2026 and recommend Final Dividend if any on equity shares of the Company for the financial year 2025-26.

Announcement under Regulation 30 (LODR)-Newspaper Publication

13-May-2026 | Source : BSE

Please find enclosed herewith the copy of intimation

Shareholder Meeting / Postal Ballot-Outcome of Postal_Ballot

12-May-2026 | Source : BSE

Postal Ballot Results.

Corporate Actions stock-summary

stock-summary
BOARD MEETING

(27 May 2026)

stock-summary
DIVIDEND

Asahi India Glass Ltd has declared 200% dividend, ex-date: 03 Sep 25

stock-summary
SPLITS

No Splits history available

stock-summary
BONUS

No Bonus history available

stock-summary
RIGHTS

Asahi India Glass Ltd has announced 13:25 rights issue, ex-date: 26 Jul 13

stock-summaryKey Factors

Quality key factors stock-summary

Factor
Value
Sales Growth (5y)
16.76%
EBIT Growth (5y)
20.77%
EBIT to Interest (avg)
4.52
Debt to EBITDA (avg)
2.51
Net Debt to Equity (avg)
0.52
Sales to Capital Employed (avg)
1.00
Tax Ratio
24.66%
Dividend Payout Ratio
13.10%
Pledged Shares
3.36%
Institutional Holding
10.20%
ROCE (avg)
15.63%
ROE (avg)
15.33%

Valuation key factors

Factor
Value
P/E Ratio
75
Industry P/E
38
Price to Book Value
6.39
EV to EBIT
44.85
EV to EBITDA
30.85
EV to Capital Employed
4.55
EV to Sales
5.30
PEG Ratio
NA
Dividend Yield
0.21%
ROCE (Latest)
9.24%
ROE (Latest)
7.75%

Technicals key factors

Indicator
Weekly
Monthly
MACD
Mildly Bullish
Mildly Bearish
RSI
No Signal
No Signal
Bollinger Bands
Bullish
Bullish
Moving Averages
Mildly Bearish (Daily)
KST
Mildly Bullish
Bullish
Dow Theory
Mildly Bullish
Mildly Bearish
OBV
Mildly Bullish
Mildly Bearish
stock-summary Technical Indicator Scale: Bearish, Mildly Bearish, Sideways, Mildly Bullish, Bullish  Turned 
stock-summaryShareholding
Shareholding Snapshot : Mar 2026stock-summary
Shareholding Compare (%holding) stock-summary
Majority shareholders

Promoters

Pledged Promoter Holdings

3.3583

Mutual Funds

Held by 25 Schemes (5.26%)

FIIs

Held by 109 FIIs (4.85%)

Promoter with highest holding

Asahi Glass Co., Ltd (21.18%)

Highest Public shareholder

Nemish S Shah (4.36%)

Individual Investors Holdings

19.24%

stock-summaryFinancial
[
  {
    "link": "quarterly",
    "btn_text": "All Quarterly Results",
    "header": "Quarterly Results Snapshot (Consolidated) - Dec'25 - QoQ",
    "rhs": [
      {
        "prefix": "Net Sales ",
        "suffix": "QoQ Growth in quarter ended Dec 2025 is 9.09% vs -6.31% in Sep 2025",
        "dir": 1
      },
      {
        "prefix": "Consolidated Net Profit ",
        "suffix": "QoQ Growth in quarter ended Dec 2025 is 75.95% vs 0.68% in Sep 2025",
        "dir": 1
      }
    ],
    "table": {
      "header": [
        "Dec'25",
        "Sep'25",
        "Change(%)"
      ],
      "body": [
        {
          "field": "Net Sales",
          "val1": "1,255.91",
          "val2": "1,151.22",
          "chgp": "9.09%",
          "chgp_class": "positive"
        },
        {
          "field": "Operating Profit (PBDIT) excl Other Income",
          "val1": "250.60",
          "val2": "188.26",
          "chgp": "33.11%",
          "chgp_class": "positive"
        },
        {
          "field": "Interest",
          "val1": "43.25",
          "val2": "59.44",
          "chgp": "-27.24%",
          "chgp_class": "positive"
        },
        {
          "field": "Exceptional Items",
          "val1": "-11.99",
          "val2": "0.00",
          "chgp": "",
          "chgp_class": "neutral"
        },
        {
          "field": "Consolidate Net Profit",
          "val1": "99.50",
          "val2": "56.55",
          "chgp": "75.95%",
          "chgp_class": "positive"
        },
        {
          "field": "Operating Profit Margin (Excl OI)",
          "val1": "20.53%",
          "val2": "16.49%",
          "chgp": "4.04%",
          "chgp_class": "positive"
        }
      ]
    }
  },
  {
    "link": "half-yearly",
    "btn_text": "All Half Yearly Results",
    "header": "Half Yearly Results Snapshot (Consolidated) - Sep'25",
    "rhs": [
      {
        "prefix": "Net Sales ",
        "suffix": " Growth in half year ended Sep 2025 is 3.91% vs 3.72% in Sep 2024",
        "dir": 1
      },
      {
        "prefix": "Consolidated Net Profit ",
        "suffix": " Growth in half year ended Sep 2025 is -35.02% vs -9.04% in Sep 2024",
        "dir": -1
      }
    ],
    "table": {
      "header": [
        "Sep'25",
        "Sep'24",
        "Change(%)"
      ],
      "body": [
        {
          "field": "Net Sales",
          "val1": "2,379.96",
          "val2": "2,290.34",
          "chgp": "3.91%",
          "chgp_class": "positive"
        },
        {
          "field": "Operating Profit (PBDIT) excl Other Income",
          "val1": "380.59",
          "val2": "393.94",
          "chgp": "-3.39%",
          "chgp_class": "negative"
        },
        {
          "field": "Interest",
          "val1": "118.76",
          "val2": "63.46",
          "chgp": "87.14%",
          "chgp_class": "negative"
        },
        {
          "field": "Exceptional Items",
          "val1": "0.00",
          "val2": "0.00",
          "chgp": "",
          "chgp_class": "neutral"
        },
        {
          "field": "Consolidate Net Profit",
          "val1": "112.72",
          "val2": "173.47",
          "chgp": "-35.02%",
          "chgp_class": "negative"
        },
        {
          "field": "Operating Profit Margin (Excl OI)",
          "val1": "16.13%",
          "val2": "17.29%",
          "chgp": "-1.16%",
          "chgp_class": "negative"
        }
      ]
    }
  },
  {
    "link": "nine-monthly",
    "btn_text": "All Nine Monthly Results",
    "header": "Nine Monthly Results Snapshot (Consolidated) - Dec'25",
    "rhs": [
      {
        "prefix": "Net Sales ",
        "suffix": "YoY Growth in nine months ended Dec 2025 is 6.48% vs 5.01% in Dec 2024",
        "dir": 1
      },
      {
        "prefix": "Consolidated Net Profit ",
        "suffix": "YoY Growth in nine months ended Dec 2025 is -23.90% vs 9.77% in Dec 2024",
        "dir": -1
      }
    ],
    "table": {
      "header": [
        "Dec'25",
        "Dec'24",
        "Change(%)"
      ],
      "body": [
        {
          "field": "Net Sales",
          "val1": "3,635.87",
          "val2": "3,414.64",
          "chgp": "6.48%",
          "chgp_class": "positive"
        },
        {
          "field": "Operating Profit (PBDIT) excl Other Income",
          "val1": "631.19",
          "val2": "569.35",
          "chgp": "10.86%",
          "chgp_class": "positive"
        },
        {
          "field": "Interest",
          "val1": "162.01",
          "val2": "95.51",
          "chgp": "69.63%",
          "chgp_class": "negative"
        },
        {
          "field": "Exceptional Items",
          "val1": "-11.99",
          "val2": "31.83",
          "chgp": "-137.67%",
          "chgp_class": "negative"
        },
        {
          "field": "Consolidate Net Profit",
          "val1": "212.22",
          "val2": "278.87",
          "chgp": "-23.90%",
          "chgp_class": "negative"
        },
        {
          "field": "Operating Profit Margin (Excl OI)",
          "val1": "17.36%",
          "val2": "16.67%",
          "chgp": "0.69%",
          "chgp_class": "positive"
        }
      ]
    }
  },
  {
    "link": "annual",
    "btn_text": "All Annual Results",
    "header": "Annual Results Snapshot (Consolidated) - Mar'25",
    "rhs": [
      {
        "prefix": "Net Sales ",
        "suffix": "YoY Growth in year ended Mar 2025 is 5.46% vs 8.41% in Mar 2024",
        "dir": -1
      },
      {
        "prefix": "Consolidated Net Profit ",
        "suffix": "YoY Growth in year ended Mar 2025 is 13.20% vs -10.11% in Mar 2024",
        "dir": 1
      }
    ],
    "table": {
      "header": [
        "Mar'25",
        "Mar'24",
        "Change(%)"
      ],
      "body": [
        {
          "field": "Net Sales",
          "val1": "4,594.48",
          "val2": "4,356.72",
          "chgp": "5.46%",
          "chgp_class": "positive"
        },
        {
          "field": "Operating Profit (PBDIT) excl Other Income",
          "val1": "766.13",
          "val2": "738.08",
          "chgp": "3.80%",
          "chgp_class": "positive"
        },
        {
          "field": "Interest",
          "val1": "128.30",
          "val2": "135.89",
          "chgp": "-5.59%",
          "chgp_class": "positive"
        },
        {
          "field": "Exceptional Items",
          "val1": "31.83",
          "val2": "0.00",
          "chgp": "",
          "chgp_class": "neutral"
        },
        {
          "field": "Consolidate Net Profit",
          "val1": "371.27",
          "val2": "327.98",
          "chgp": "13.20%",
          "chgp_class": "positive"
        },
        {
          "field": "Operating Profit Margin (Excl OI)",
          "val1": "16.83%",
          "val2": "17.09%",
          "chgp": "-0.26%",
          "chgp_class": "negative"
        }
      ]
    }
  }
]

Quarterly Results Snapshot (Consolidated) - Dec'25 - QoQstock-summary

Dec'25
Sep'25
Change(%)
Net Sales
1,255.91
1,151.22
9.09%
Operating Profit (PBDIT) excl Other Income
250.60
188.26
33.11%
Interest
43.25
59.44
-27.24%
Exceptional Items
-11.99
0.00
Consolidate Net Profit
99.50
56.55
75.95%
Operating Profit Margin (Excl OI)
20.53%
16.49%
4.04%
Values in Rs Cr.
Direction Arrows
Net Sales

QoQ Growth in quarter ended Dec 2025 is 9.09% vs -6.31% in Sep 2025

Direction Arrows
Consolidated Net Profit

QoQ Growth in quarter ended Dec 2025 is 75.95% vs 0.68% in Sep 2025

Half Yearly Results Snapshot (Consolidated) - Sep'25stock-summary

Sep'25
Sep'24
Change(%)
Net Sales
2,379.96
2,290.34
3.91%
Operating Profit (PBDIT) excl Other Income
380.59
393.94
-3.39%
Interest
118.76
63.46
87.14%
Exceptional Items
0.00
0.00
Consolidate Net Profit
112.72
173.47
-35.02%
Operating Profit Margin (Excl OI)
16.13%
17.29%
-1.16%
Values in Rs Cr.
Direction Arrows
Net Sales

Growth in half year ended Sep 2025 is 3.91% vs 3.72% in Sep 2024

Direction Arrows
Consolidated Net Profit

Growth in half year ended Sep 2025 is -35.02% vs -9.04% in Sep 2024

Nine Monthly Results Snapshot (Consolidated) - Dec'25stock-summary

Dec'25
Dec'24
Change(%)
Net Sales
3,635.87
3,414.64
6.48%
Operating Profit (PBDIT) excl Other Income
631.19
569.35
10.86%
Interest
162.01
95.51
69.63%
Exceptional Items
-11.99
31.83
-137.67%
Consolidate Net Profit
212.22
278.87
-23.90%
Operating Profit Margin (Excl OI)
17.36%
16.67%
0.69%
Values in Rs Cr.
Direction Arrows
Net Sales

YoY Growth in nine months ended Dec 2025 is 6.48% vs 5.01% in Dec 2024

Direction Arrows
Consolidated Net Profit

YoY Growth in nine months ended Dec 2025 is -23.90% vs 9.77% in Dec 2024

Annual Results Snapshot (Consolidated) - Mar'25stock-summary

Mar'25
Mar'24
Change(%)
Net Sales
4,594.48
4,356.72
5.46%
Operating Profit (PBDIT) excl Other Income
766.13
738.08
3.80%
Interest
128.30
135.89
-5.59%
Exceptional Items
31.83
0.00
Consolidate Net Profit
371.27
327.98
13.20%
Operating Profit Margin (Excl OI)
16.83%
17.09%
-0.26%
Values in Rs Cr.
Direction Arrows
Net Sales

YoY Growth in year ended Mar 2025 is 5.46% vs 8.41% in Mar 2024

Direction Arrows
Consolidated Net Profit

YoY Growth in year ended Mar 2025 is 13.20% vs -10.11% in Mar 2024

stock-summaryCompany CV
About Asahi India Glass Ltd stock-summary
stock-summary
Asahi India Glass Ltd
Small Cap
Auto Components & Equipments
Asahi India Glass Limited was incorporated in 1984 as Indian Auto Safety Glasses Limited. The Company was promoted as a Joint Venture by Maruti Udyog, Asahi Glass Company, Japan and B M Labroo and Associates. Asahi Glass Company, Japan, provides the technical assistance to the Company. The name of the Company was thereafter changed from Indian Auto Safety Glasses Limited to Asahi India Safety Glass Limited and further to Asahi India Glass Limited effective from 26th September 2002.
Company Coordinates stock-summary
Company Details
Unit 203 to 208 Ishwar Nagar, Tribhuwan Complex Mathura Road New Delhi New Delhi : 110065
stock-summary
Tel: 91-011-49454900
stock-summary
investorrelations@aisglass.com
Registrar Details
Link Intime India Pvt Ltd, C-13 Pannalal Silk Compound, L B S Marg, Bhandup , Mumbai