
Compare Gabriel India with Similar Stocks
Dashboard
Low Debt Company with Strong Long Term Fundamental Strength
- Healthy long term growth as Operating profit has grown by an annual rate 36.69%
- The company is Net-Debt Free
- The company has been able to generate a Return on Capital Employed (avg) of 27.07% signifying high profitability per unit of total capital (equity and debt)
Rising Promoter Confidence
Consistent Returns over the last 3 years
Stock DNA
Auto Components & Equipments
INR 17,854 Cr (Small Cap)
67.00
37
0.40%
-0.12
19.19%
12.79
Total Returns (Price + Dividend) 
Latest dividend: 1.9000000000000001 per share ex-dividend date: Nov-21-2025
Risk Adjusted Returns v/s
Returns Beta

News

Gabriel India Ltd Upgraded to Buy on Strong Technical and Fundamental Signals
Gabriel India Ltd, a prominent player in the Auto Components & Equipments sector, has seen its investment rating upgraded from Hold to Buy by MarketsMOJO as of 23 June 2026. This upgrade reflects a comprehensive reassessment across four critical parameters: Quality, Valuation, Financial Trend, and Technicals. The company’s robust long-term fundamentals, improving technical indicators, and rising promoter confidence underpin this positive outlook despite recent flat quarterly results.
Read full news article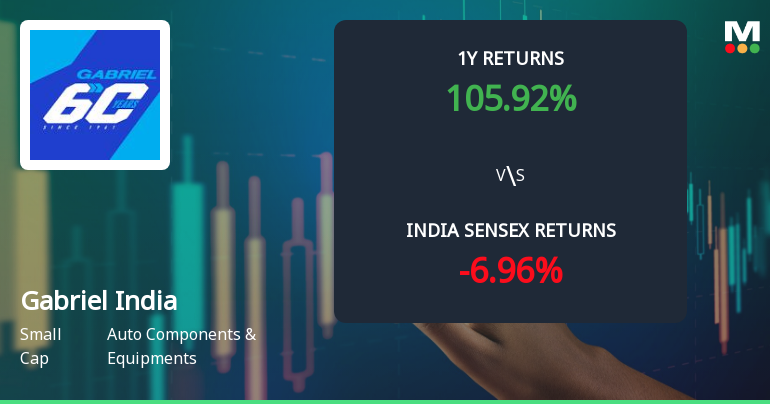
Gabriel India Ltd Technical Momentum Shifts Signal Bullish Outlook
Gabriel India Ltd, a key player in the Auto Components & Equipments sector, has witnessed a notable shift in its technical momentum, upgrading from a mildly bullish to a bullish stance. This change is underscored by a confluence of positive signals across multiple technical indicators, suggesting an improving price trajectory despite a recent minor dip in share price.
Read full news article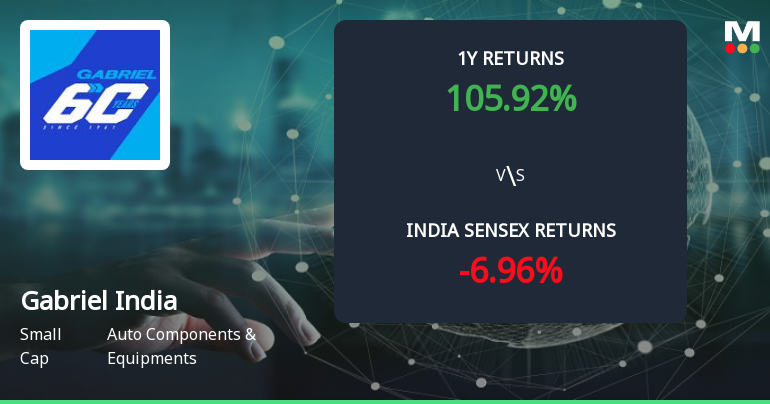
Golden Cross Forms in Gabriel India Ltd — On a Day the Stock Fell 1.92%. What the Mixed Signals Mean
The 50-day moving average has crossed above the 200-day moving average for Gabriel India Ltd, signalling a golden cross on 23 Jun 2026. Yet, the stock declined 1.92% on the day the cross formed, while monthly momentum indicators remain mildly bearish. This juxtaposition of signals calls for a detailed examination of the technical and fundamental context to assess the reliability of this crossover.
Read full news article Announcements
Announcement under Regulation 30 (LODR)-Newspaper Publication
16-Jun-2026 | Source : BSENewspaper Advertisement for transfer of equity shares of the Company to the Investor Education and Protection Fund
Announcement under Regulation 30 (LODR)-Newspaper Publication
16-Jun-2026 | Source : BSENewspaper publication for opening of special window for re-lodgement of transfer request of physical shares
Disclosures under Reg. 29(1) of SEBI (SAST) Regulations 2011
12-Jun-2026 | Source : BSEThe Exchange has received the disclosure under Regulation 29(1) of SEBI (Substantial Acquisition of Shares & Takeovers) Regulations 2011 for Anfilco Ltd & Others
Corporate Actions

No Upcoming Board Meetings

Gabriel India Ltd has declared 190% dividend, ex-date: 21 Nov 25

No Splits history available

Gabriel India Ltd has announced 1:1 bonus issue, ex-date: 12 Jul 12

No Rights history available
Quality key factors
Valuation key factors
Technicals key factors
 Technical Indicator Scale: Bearish, Mildly Bearish, Sideways, Mildly Bullish, Bullish Turned
 Shareholding Snapshot : Jun 2026
Shareholding Compare (%holding)
Promoters
None
Held by 29 Schemes (12.02%)
Held by 127 FIIs (6.51%)
Asia Investments Private Limited (42.67%)
Hdfc Mutual Fund - Hdfc Multi Cap Fund (6.57%)
14.12%
Quarterly Results Snapshot (Consolidated) - Mar'26 - YoY

YoY Growth in quarter ended Mar 2026 is 12.71% vs 17.03% in Mar 2025
YoY Growth in quarter ended Mar 2026 is 3.33% vs 31.24% in Mar 2025
Half Yearly Results Snapshot (Consolidated) - Sep'25
Growth in half year ended Sep 2025 is 15.45% vs 18.17% in Sep 2024
Growth in half year ended Sep 2025 is 8.70% vs 36.40% in Sep 2024
Nine Monthly Results Snapshot (Consolidated) - Dec'25
YoY Growth in nine months ended Dec 2025 is 15.62% vs 20.30% in Dec 2024
YoY Growth in nine months ended Dec 2025 is 2.80% vs 39.37% in Dec 2024
Annual Results Snapshot (Consolidated) - Mar'26
YoY Growth in year ended Mar 2026 is 14.85% vs 19.42% in Mar 2025
YoY Growth in year ended Mar 2026 is 2.93% vs 37.05% in Mar 2025
About Gabriel India Ltd

Company Coordinates


