
Compare Asahi India Glas with Similar Stocks
Stock DNA
Auto Components & Equipments
INR 22,017 Cr (Small Cap)
62.00
37
0.22%
0.50
8.99%
5.59
Total Returns (Price + Dividend) 
Latest dividend: 2 per share ex-dividend date: Sep-03-2025
Risk Adjusted Returns v/s
Returns Beta

News
Asahi India Glass Ltd is Rated Sell
Asahi India Glass Ltd is rated Sell by MarketsMOJO. This rating was last updated on 29 May 2026, reflecting a reassessment of the stock’s outlook. However, all fundamentals, returns, and financial metrics discussed below are current as of 23 June 2026, providing investors with the latest perspective on the company’s position in the market.
Read full news article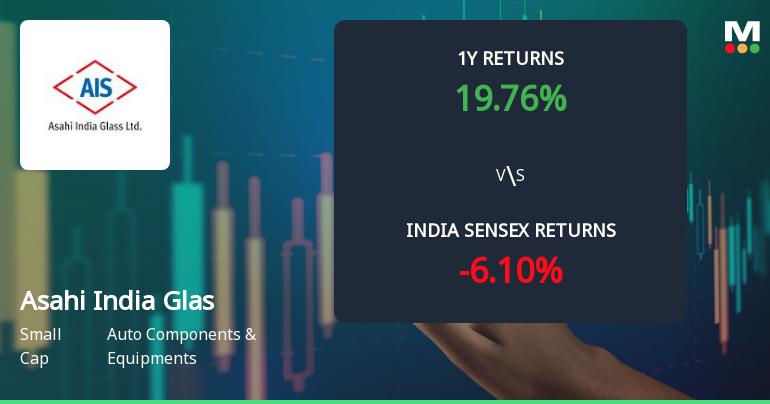
Asahi India Glass Ltd Technical Momentum Shifts Amid Mixed Indicator Signals
Asahi India Glass Ltd (AIGL), a key player in the Auto Components & Equipments sector, has experienced a subtle shift in its technical momentum, moving from a sideways trend to a mildly bearish stance. This transition is underscored by a complex interplay of technical indicators, including MACD, RSI, moving averages, and Bollinger Bands, which collectively paint a nuanced picture of the stock’s near-term outlook.
Read full news article
Asahi India Glass Ltd Technical Momentum Shifts Amid Mixed Market Signals
Asahi India Glass Ltd (AIGL) has experienced a notable shift in its technical momentum, moving from a mildly bearish stance to a sideways trend, reflecting a complex interplay of technical indicators. Despite a recent upgrade in price momentum, the stock remains under pressure with a MarketsMOJO Mojo Grade downgrade to Sell, signalling caution for investors amid mixed signals from MACD, RSI, and moving averages.
Read full news article Announcements
Announcement under Regulation 30 (LODR)-Newspaper Publication
28-May-2026 | Source : BSEPlease find enclosed herewith the copy of intimation
Compliances-Reg.24(A)-Annual Secretarial Compliance
28-May-2026 | Source : BSEPlease find enclosed herewith Annual Secretarial Compliance Report for the financial year 2025-26.
Results For The Quarter And Financial Year Ended 31St March 2026.
27-May-2026 | Source : BSEFinancial Results for the quarter and financial year ended 31st March 2026.
Corporate Actions

No Upcoming Board Meetings

Asahi India Glass Ltd has declared 200% dividend, ex-date: 03 Sep 25

No Splits history available

No Bonus history available

Asahi India Glass Ltd has announced 13:25 rights issue, ex-date: 26 Jul 13
Quality key factors
Valuation key factors
Technicals key factors
 Technical Indicator Scale: Bearish, Mildly Bearish, Sideways, Mildly Bullish, Bullish Turned
 Shareholding Snapshot : Mar 2026
Shareholding Compare (%holding)
Promoters
3.3583
Held by 25 Schemes (5.26%)
Held by 109 FIIs (4.85%)
Asahi Glass Co., Ltd (21.18%)
Nemish S Shah (4.36%)
19.24%
Quarterly Results Snapshot (Consolidated) - Mar'26 - QoQ

QoQ Growth in quarter ended Mar 2026 is 7.82% vs 9.09% in Dec 2025
QoQ Growth in quarter ended Mar 2026 is 33.15% vs 75.95% in Dec 2025
Half Yearly Results Snapshot (Consolidated) - Sep'25

Growth in half year ended Sep 2025 is 3.91% vs 3.72% in Sep 2024
Growth in half year ended Sep 2025 is -35.02% vs -9.04% in Sep 2024
Nine Monthly Results Snapshot (Consolidated) - Dec'25
YoY Growth in nine months ended Dec 2025 is 6.48% vs 5.01% in Dec 2024
YoY Growth in nine months ended Dec 2025 is -23.90% vs 9.77% in Dec 2024
Annual Results Snapshot (Consolidated) - Mar'26
YoY Growth in year ended Mar 2026 is 8.61% vs 5.46% in Mar 2025
YoY Growth in year ended Mar 2026 is -7.16% vs 13.20% in Mar 2025
About Asahi India Glass Ltd

Company Coordinates


