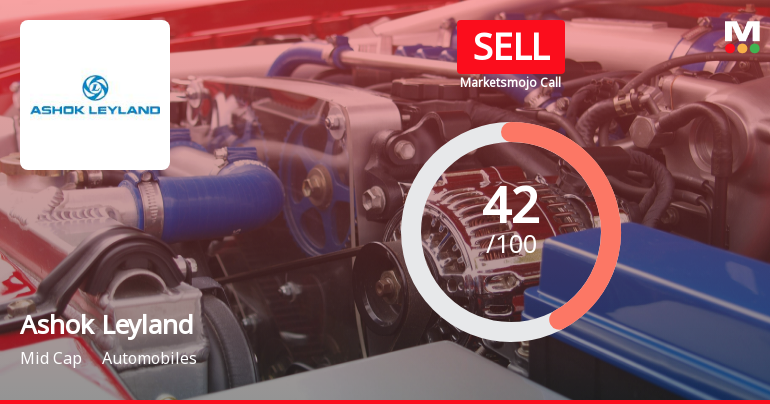
Ashok Leyland

  • Market Cap: Mid Cap
  • Industry: Automobiles
  • ISIN: INE208A01029
  • NSEID: ASHOKLEY
  • BSEID: 500477
INR
163.00
4.38 (2.76%)
BSENSE

Sep 18, 03:30 PM

BSE+NSE Vol: 1.82 cr

  • Price Points
  • Score
  • Mojo Parameters
  • Total Return
  • News and Corporate Actions
  • Key factors
  • Shareholding
  • Financials
  • CompanyCV
stock-summaryPrice Point
High/Low

1Day

52 Week

Valuation
Technical
Day's Volume

CASH

1.82 cr (13.81%) Volume

Shareholding (Jun 2026)

FII

20.68%

Held by 711 FIIs

DII

15.82%

Held by 249 DIIs

Promoter

51.51%

Why is Ashok Leyland Ltd. falling/rising?

06-Sep-2026

As of 05-Sep, Ashok Leyland Ltd. is seeing its stock price rise to Rs 170.00, driven by recent gains and strong long-term growth metrics despite some negative indicators. The stock's attractive valuation compared to peers suggests potential for continued investment interest.

As of 05-Sep, Ashok Leyland Ltd. is experiencing a rise in its stock price, currently at Rs 170.00, reflecting an increase of 1.1 (0.65%). This upward movement can be attributed to a few key factors. Firstly, the stock has been gaining for the last two days, with a total return of 1.31% during this period. Additionally, the stock reached an intraday high of Rs 173.25, which is a 2.58% increase from its previous price.<BR><BR>Despite some negative indicators, such as a decline in delivery volume by 37.68% compared to the 5-day average, the overall performance today is described as inline with the sector. The stock's long-term growth prospects remain healthy, with net sales growing at an annual rate of 21.24% and operating profit increasing by 40.11%. Furthermore, the stock is trading at a discount compared to its peers' average historical valuations, which suggests attractive investment potential.<BR><BR>Overall, while there are some concerns regarding investor participation, the recent gains, strong long-term growth metrics, and favorable valuation contribute to the stock's rising price.

View full answer

Who are in the management team of Ashok Leyland?

01-Sep-2026

The management team of Ashok Leyland includes D G Hinduja (Executive Chairman), Shenu Agarwal (Managing Director & CEO), Gopal Mahadevan (Whole Time Director & CFO), and N Ramanathan (Company Secretary). The board also features several non-executive and independent directors, enhancing the company's governance and strategic direction.

The management team of Ashok Leyland includes the following key individuals:<BR><BR>1. **D G Hinduja** - Executive Chairman<BR>2. **Shenu Agarwal** - Managing Director & CEO<BR>3. **Gopal Mahadevan** - Whole Time Director & CFO<BR>4. **N Ramanathan** - Company Secretary & Compliance Officer<BR><BR>Additionally, the board features several non-executive and independent directors, including:<BR><BR>- **Jean Brunol**<BR>- **Sanjay K Asher**<BR>- **Andreas H Biagosch**<BR>- **Manisha Girotra**<BR>- **Jose Maria Alapont**<BR>- **Saugata Gupta**<BR>- **C Bhaktavatsala Rao**<BR>- **Shom Hinduja**<BR><BR>This diverse team brings a wealth of experience to the company, contributing to its strategic direction and governance.

View full answer

What does Ashok Leyland do?

01-Sep-2026

Ashok Leyland Ltd. manufactures and sells commercial vehicles and is a mid-cap player in the automobile industry. As of June 2026, it reported net sales of ₹13,070 Cr and a net profit of ₹616 Cr, with a market cap of ₹102,587 Cr.

Overview:<BR>Ashok Leyland Ltd. is engaged in the manufacture and sale of commercial vehicles, operating within the mid-cap segment of the automobiles industry.<BR><BR>History:<BR>Ashok Leyland was incorporated in the year 1948. The latest quarterly results reported are for June 2026, showcasing the company's ongoing operations in the commercial vehicle sector.<BR><BR>Financial Snapshot:<BR>- Net Sales: 13,070 Cr (Quarterly Results - Jun 2026)<BR>- Net Profit: 616 Cr (Quarterly Results - Jun 2026)<BR>- Market cap: INR 102,587 Cr (Mid Cap)<BR><BR>Key Metrics:<BR>- P/E: 27.00<BR>- Industry P/E: 29<BR>- Dividend Yield: 1.99%<BR>- Debt Equity: 3.29<BR>- Return on Equity: 26.31%<BR>- Price to Book: 7.26<BR><BR>Contact Details:<BR>Address: No 1 Sardar Patel Road, Guindy Chennai Tamil Nadu : 600032<BR>Tel: 91-44-22206000<BR>Email: secretarial@ashokleyland.<BR>Website: http://www.ashokleyland.com

View full answer

Who are the peers of the Ashok Leyland?

01-Sep-2026

Ashok Leyland's peers include TVS Motor Co., Hyundai Motor I, Tata Motors PVeh, Hero MotoCorp, Ather Energy, Escorts Kubota, Force Motors, Ola Electric, and BEML Ltd. In terms of management risk and growth, Ashok Leyland is rated as having good management risk and excellent growth, with a 1-year return of 38.02%.

Peers: The peers of Ashok Leyland are TVS Motor Co., Hyundai Motor I, Tata Motors PVeh, Hero MotoCorp, Ather Energy, Escorts Kubota, Force Motors, Ola Electric, and BEML Ltd.<BR><BR>Quality Snapshot: Excellent management risk is observed at Hyundai Motor I and Hero MotoCorp, while Good management risk is found at TVS Motor Co., Tata Motors PVeh, Ashok Leyland, and Escorts Kubota. Average management risk is present at Force Motors and BEML Ltd, while Below Average management risk is noted at Ather Energy and Ola Electric. In terms of Growth, Excellent growth is seen at TVS Motor Co., Ashok Leyland, and Ather Energy, while Average growth is found at Hero MotoCorp and the rest. Below Average growth is noted at Tata Motors PVeh, Escorts Kubota, and Ola Electric. Capital Structure ratings show Excellent at Hyundai Motor I and Hero MotoCorp, Average at Tata Motors PVeh and Force Motors, and Below Average at Ashok Leyland, Ather Energy, and Ola Electric.<BR><BR>Return Snapshot: Ather Energy has the highest 1-year return at 273.18%, while Hyundai Motor I has the lowest at -9.34%. Ashok Leyland's 1-year return of 38.02% is significantly higher than Hyundai Motor I's. Additionally, the six-month return is negative for Tata Motors PVeh, Escorts Kubota, Force Motors, and Ola Electric.

View full answer

How big is Ashok Leyland?

01-Sep-2026

As of 31st August, Ashok Leyland Ltd. has a market capitalization of 102,587.00 Cr, with net sales of 57,723.13 Cr and a net profit of 3,475.77 Cr reported in the latest four quarters. The company has shareholder's funds of 14,241.69 Cr and total assets of 1,00,704.23 Cr for the annual period ending March 2026.

As of 31st August, Ashok Leyland Ltd. has a market capitalization of 102,587.00 Cr, categorizing it as a Mid Cap company.<BR><BR>In the latest four quarters, Ashok Leyland reported net sales of 57,723.13 Cr and a net profit of 3,475.77 Cr.<BR><BR>For the latest annual period ending March 2026, the company had shareholder's funds amounting to 14,241.69 Cr and total assets of 1,00,704.23 Cr.

View full answer

Should I buy, sell or hold Ashok Leyland Ltd.?

16-Aug-2026

When is the next results date for Ashok Leyland Ltd.?

04-Aug-2026

The next results date for Ashok Leyland Ltd. is 14 August 2026.

The next results date for Ashok Leyland Ltd. is scheduled for 14 August 2026.

View full answer

Are Ashok Leyland Ltd. latest results good or bad?

29-May-2026

Ashok Leyland Ltd.'s latest results show strong revenue growth, achieving ₹17,246.44 crores in Q4 FY26, a 17.36% increase year-on-year. However, profitability concerns arise from declining operating margins and a high debt-to-equity ratio, indicating potential financial stability challenges.

Ashok Leyland Ltd.'s latest results present a mixed picture. On one hand, the company achieved its highest-ever quarterly revenue of ₹17,246.44 crores in Q4 FY26, marking a significant 17.36% increase year-on-year and a 16.29% rise sequentially. This strong revenue growth reflects robust demand in the commercial vehicle sector, particularly in medium and heavy vehicles.<BR><BR>However, there are concerns regarding profitability and financial health. The net profit for the quarter was ₹1,290.70 crores, which, while representing a 14.21% increase year-on-year, shows a decline compared to the previous year's growth rate. Additionally, the operating margin decreased to 19.30%, down 113 basis points from the same quarter last year, indicating persistent cost pressures.<BR><BR>Moreover, the company's debt-to-equity ratio remains high at 3.57 times, raising concerns about financial flexibility and the ability to manage debt in a competitive environment. The interest coverage ratio is also weak, averaging just 1.83 times, which could pose challenges in servicing debt obligations, especially in a rising interest rate environment.<BR><BR>In summary, while Ashok Leyland's revenue growth is commendable, the ongoing margin pressures and high leverage present significant challenges that could impact its financial stability moving forward. Thus, the results can be seen as good in terms of revenue but concerning when considering profitability and debt levels.

View full answer

Is Ashok Leyland overvalued or undervalued?

28-Nov-2025

As of November 27, 2025, Ashok Leyland is considered overvalued with a PE ratio of 27.83 and an EV to EBITDA of 13.96, despite a strong year-to-date return of 44.87%, indicating limited upside potential compared to its peers.

As of 27 November 2025, Ashok Leyland's valuation grade has moved from fair to expensive, indicating a shift in its market perception. The company is currently considered overvalued. Key ratios include a PE ratio of 27.83, an EV to EBITDA of 13.96, and a ROE of 26.79%. <BR><BR>In comparison with peers, Force Motors is rated attractive with a PE of 27.65, while SML Mahindra is also classified as expensive with a PE of 30.85. Despite Ashok Leyland's strong performance, reflected in a year-to-date return of 44.87% compared to the Sensex's 9.70%, the current valuation suggests that the stock may not offer further upside potential at this price point.

View full answer

How has been the historical performance of Ashok Leyland?

17-Nov-2025

Ashok Leyland has shown significant growth in net sales and profitability from March 2021 to March 2025, with net sales rising from 19,454.10 Cr to 48,535.14 Cr and profit after tax recovering from a loss of 292.97 Cr to a profit of 3,351.21 Cr. The company also improved its operating profit margin from 10.59% to 19.05% during this period.

Answer:<BR>The historical performance of Ashok Leyland shows a significant upward trend in net sales and profitability over the past few years, culminating in the fiscal year ending March 2025.<BR><BR>Breakdown:<BR>Ashok Leyland's net sales have increased from 19,454.10 Cr in March 2021 to 48,535.14 Cr in March 2025, reflecting a strong growth trajectory. Total operating income has followed a similar pattern, rising from 26,237.15 Cr in March 2022 to 48,535.14 Cr in March 2025. Despite fluctuations in raw material costs, which peaked at 28,272.18 Cr in March 2023, the company managed to maintain a healthy operating profit margin, which improved from 10.59% in March 2022 to 19.05% in March 2025. Profit before tax also saw a remarkable recovery, moving from a loss of 207.11 Cr in March 2022 to a profit of 4,564.75 Cr in March 2025. Consequently, profit after tax surged from a loss of 292.97 Cr in March 2022 to 3,351.21 Cr in March 2025. The company's total assets grew from 38,119.15 Cr in March 2020 to 81,546.31 Cr in March 2025, while total liabilities increased from 38,119.15 Cr to 81,546.31 Cr in the same period, indicating a balanced growth in both assets and liabilities. Cash flow from operating activities improved significantly, turning positive at 128.00 Cr in March 2025 after a series of negative cash flows in previous years. Overall, Ashok Leyland's financial performance demonstrates a robust recovery and growth in both revenue and profitability metrics over the analyzed period.

View full answer

Has Ashok Leyland declared dividend?

14-Nov-2025

Yes, Ashok Leyland has declared a dividend of 100%, amounting to ₹4.25 per share, with an ex-date of November 18, 2025. The company has shown strong total returns across various periods, with a 5-year total return of 259.49%.

Ashok Leyland Ltd. has declared a dividend.<BR><BR>Dividend Details:<BR>- Percentage announced: 100%<BR>- Amount per share: 4.25<BR>- Ex-date: 18 Nov 25<BR><BR>Dividend Yield: 2.08%.<BR><BR>Total Returns by Period:<BR>In the 3 months period, Ashok Leyland experienced a price return of 21.57%, a dividend return of 0.76%, resulting in a total return of 22.33%.<BR><BR>Over the 6 months period, the company achieved a price return of 26.36%, a dividend return of 4.35%, leading to a total return of 30.71%.<BR><BR>In the 1 year period, Ashok Leyland saw a price return of 36.23%, a dividend return of 4.74%, culminating in a total return of 40.97%.<BR><BR>For the 2 years period, the price return was 70.5%, with a dividend return of 13.63%, resulting in a total return of 84.13%.<BR><BR>During the 3 years period, the company recorded a price return of 94.04%, a dividend return of 19.89%, which gave a total return of 113.93%.<BR><BR>In the 4 years period, Ashok Leyland had a price return of 103.64%, a dividend return of 26.50%, leading to a total return of 130.14%.<BR><BR>Lastly, over the 5 years period, the company achieved a price return of 224.93%, with a dividend return of 34.56%, resulting in a total return of 259.49%.<BR><BR>Overall, Ashok Leyland has declared a significant dividend and demonstrated strong total returns across various periods, indicating a positive performance for investors.

View full answer

Is Ashok Leyland technically bullish or bearish?

28-Oct-2025

As of 27 October 2025, the market trend is bullish, supported by strong MACD and moving averages, although a mildly bearish KST signal on the monthly tempers the outlook.

As of 27 October 2025, the technical trend has changed from mildly bullish to bullish. The current stance is bullish with strong indicators supporting this view. The MACD is bullish on both the weekly and monthly time frames, and the moving averages on the daily chart also indicate bullish momentum. The Bollinger Bands are bullish on the weekly and mildly bullish on the monthly, suggesting price strength. However, the KST shows a mildly bearish signal on the monthly, which slightly tempers the overall bullish outlook. The Dow Theory indicates a mildly bullish stance on the weekly but no trend on the monthly. Overall, the strength of the bullish trend is reinforced by recent price action, with today's high surpassing the previous close and a notable return compared to the Sensex over various periods.

View full answer

Who are the top shareholders of the Ashok Leyland?

17-Jul-2025

The top shareholders of Ashok Leyland include Hinduja Automotive Limited as the largest promoter with 35.0%, followed by foreign institutional investors at 23.5%, mutual funds at 7.29%, and individual investors holding 9.56%, with the Government of Singapore as the highest public shareholder at 3.11%. The ownership structure shows a significant presence of both promoters and institutional investors.

The top shareholders of Ashok Leyland include a mix of promoters, institutional investors, and individual shareholders. The majority of the shares are held by promoters, with Hinduja Automotive Limited being the largest promoter, holding 35.0% of the company. <BR><BR>In terms of institutional investors, mutual funds hold 7.29% through 27 schemes, while foreign institutional investors (FIIs) account for 23.5% of the shares, represented by 660 FIIs. The highest public shareholder is the Government of Singapore, which holds 3.11%. Individual investors collectively own 9.56% of the company. <BR><BR>Overall, the ownership structure reflects a strong presence of both promoter and institutional holdings.

View full answer

What is the bonus history of Ashok Leyland?

11-Jul-2025

Ashok Leyland has a history of issuing bonuses, with the most recent being a 1:1 bonus announced on July 16, 2025, and a previous 1:1 bonus on August 2, 2011. This reflects the company's strategy to reward its shareholders.

Ashok Leyland has a notable bonus history. The most recent bonus issue was a 1:1 bonus announced with an ex-date of July 16, 2025. Prior to this, the company issued a 1:1 bonus on August 2, 2011, with a record date of August 3, 2011. This consistent approach to bonus issues reflects the company's strategy to reward shareholders. If you have any more questions about Ashok Leyland or need further details, feel free to ask!

View full answer
iScoreScore
Click here to find our call on this stock
Strong Sell
Sell
Hold
Buy
Strong Buy

Dashboard

1

High Debt Company with a Debt to Equity ratio (avg) of 3.16 times

  • High Debt Company with a Debt to Equity ratio (avg) of 3.16 times
2

Flat results in Jun 26

3

40.1% of Promoter Shares are Pledged

stock-summaryMojo Parameters

Mojo Parameters

Loading Valuation Snapshot...

Stock DNA

stock-summary
Industry

Automobiles

stock-summary
Market cap

INR 93,688 Cr (Mid Cap)

stock-summary
P/E

25.00

stock-summary
Industry P/E

27

stock-summary
Dividend Yield

2.20%

stock-summary
Debt Equity

3.29

stock-summary
Return on Equity

26.31%

stock-summary
Price to Book

6.55

Revenue and Profits:
Net Sales:
13,070 Cr
(Quarterly Results - Jun 2026)
Net Profit:
616 Cr
stock-summaryTotal Returns
Total Returns (Price + Dividend) stock-summary
Dividend Yield (2.2%)
TimePeriod
Price Return
Dividend Return
Total Return
3 Months
2.87%
0%
2.87%
6 Months
-8.74%
1.50%
-7.24%
1 Year
17.47%
2.49%
19.96%
2 Years
38.16%
5.63%
43.79%
3 Years
77.5%
10.59%
88.09%
4 Years
103.19%
13.95%
117.14%
5 Years
160.47%
15.07%
175.54%

Latest dividend: 2.5 per share ex-dividend date: Jun-03-2026

Risk Adjusted Returns v/s stock-summary
Returns Beta
Icon
Beta has not been calculated since enough price history is not available
stock-summaryNews & Corporate Actions

News

Ashok Leyland Declines 3.56%: Technical Weakness and Financial Concerns Weigh

Announcements stock-summary

Ashok Leyland Limited - Press Release

27-Nov-2019 | Source : NSE

Ashok Leyland Limited has informed the Exchange regarding a press release dated November 27, 2019, titled "Ashok Leyland bags order for 1750 Buses

Ashok Leyland Limited - Press Release

26-Nov-2019 | Source : NSE

Ashok Leyland Limited has informed the Exchange regarding a press release dated November 25, 2019, titled "Ashok Leyland partners with ICICI Bank ".

Ashok Leyland Limited - Clarification

18-Nov-2019 | Source : NSE

Ashok Leyland Limited with respect to announcement dated 08-Nov-2019, regarding Change in Director(s) of the company.". On basis of above the Company is required to clarify following: 1. Date of appointment/cessation (as applicable) & term of appointment. The response of the Company is awaited.

Corporate Actions stock-summary

stock-summary
BOARD MEETING

No Upcoming Board Meetings

stock-summary
DIVIDEND

Ashok Leyland Ltd. has declared 250% dividend, ex-date: 03 Jun 26

stock-summary
SPLITS

No Splits history available

stock-summary
BONUS

Ashok Leyland Ltd. has announced 1:1 bonus issue, ex-date: 16 Jul 25

stock-summary
RIGHTS

No Rights history available

stock-summaryKey Factors

Quality key factors stock-summary

Factor
Value
Sales Growth (5y)
21.24%
EBIT Growth (5y)
40.11%
EBIT to Interest (avg)
1.94
Debt to EBITDA (avg)
6.40
Net Debt to Equity (avg)
3.29
Sales to Capital Employed (avg)
0.87
Tax Ratio
28.43%
Dividend Payout Ratio
59.23%
Pledged Shares
40.10%
Institutional Holding
36.51%
ROCE (avg)
12.80%
ROE (avg)
18.77%

Valuation key factors

Factor
Value
P/E Ratio
25
Industry P/E
27
Price to Book Value
6.71
EV to EBIT
14.53
EV to EBITDA
12.97
EV to Capital Employed
2.33
EV to Sales
2.47
PEG Ratio
1.50
Dividend Yield
2.15%
ROCE (Latest)
15.72%
ROE (Latest)
26.31%

Technicals key factors

Indicator
Weekly
Monthly
MACD
Bullish
Mildly Bearish
RSI
No Signal
No Signal
Bollinger Bands
Mildly Bullish
Mildly Bullish
Moving Averages
Bearish (Daily)
KST
Bullish
Bullish
Dow Theory
Mildly Bearish
Mildly Bullish
OBV
Mildly Bearish
Bullish
stock-summary Technical Indicator Scale: Bearish, Mildly Bearish, Sideways, Mildly Bullish, Bullish  Turned 
stock-summaryShareholding
Shareholding Snapshot : Jun 2026stock-summary
Shareholding Compare (%holding) stock-summary
Majority shareholders

Promoters

Pledged Promoter Holdings

40.099

Mutual Funds

Held by 44 Schemes (9.73%)

FIIs

Held by 711 FIIs (20.68%)

Promoter with highest holding

Hinduja Automotive Limited (34.99%)

Highest Public shareholder

Kotak Mahindra Trustee Co Ltd (under Various Sub Accounts) (1.65%)

Individual Investors Holdings

10.35%

stock-summaryFinancial
[
  {
    "link": "quarterly",
    "btn_text": "All Quarterly Results",
    "header": "Quarterly Results Snapshot (Consolidated) - Jun'26 - YoY",
    "rhs": [
      {
        "prefix": "Net Sales ",
        "suffix": "YoY Growth in quarter ended Jun 2026 is 11.62% vs 9.18% in Jun 2025",
        "dir": 1
      },
      {
        "prefix": "Consolidated Net Profit ",
        "suffix": "YoY Growth in quarter ended Jun 2026 is 0.78% vs 20.02% in Jun 2025",
        "dir": -1
      }
    ],
    "table": {
      "header": [
        "Jun'26",
        "Jun'25",
        "Change(%)"
      ],
      "body": [
        {
          "field": "Net Sales",
          "val1": "13,069.59",
          "val2": "11,708.54",
          "chgp": "11.62%",
          "chgp_class": "positive"
        },
        {
          "field": "Operating Profit (PBDIT) excl Other Income",
          "val1": "2,410.07",
          "val2": "2,173.13",
          "chgp": "10.90%",
          "chgp_class": "positive"
        },
        {
          "field": "Interest",
          "val1": "1,340.60",
          "val2": "1,111.90",
          "chgp": "20.57%",
          "chgp_class": "negative"
        },
        {
          "field": "Exceptional Items",
          "val1": "0.00",
          "val2": "0.00",
          "chgp": "",
          "chgp_class": "neutral"
        },
        {
          "field": "Consolidate Net Profit",
          "val1": "615.81",
          "val2": "611.07",
          "chgp": "0.78%",
          "chgp_class": "positive"
        },
        {
          "field": "Operating Profit Margin (Excl OI)",
          "val1": "18.51%",
          "val2": "18.64%",
          "chgp": "-0.13%",
          "chgp_class": "negative"
        }
      ]
    }
  },
  {
    "link": "half-yearly",
    "btn_text": "All Half Yearly Results",
    "header": "Half Yearly Results Snapshot (Consolidated) - Sep'25",
    "rhs": [
      {
        "prefix": "Net Sales ",
        "suffix": " Growth in half year ended Sep 2025 is 11.17% vs 3.43% in Sep 2024",
        "dir": 1
      },
      {
        "prefix": "Consolidated Net Profit ",
        "suffix": " Growth in half year ended Sep 2025 is 12.52% vs 13.54% in Sep 2024",
        "dir": -1
      }
    ],
    "table": {
      "header": [
        "Sep'25",
        "Sep'24",
        "Change(%)"
      ],
      "body": [
        {
          "field": "Net Sales",
          "val1": "24,285.40",
          "val2": "21,844.38",
          "chgp": "11.17%",
          "chgp_class": "positive"
        },
        {
          "field": "Operating Profit (PBDIT) excl Other Income",
          "val1": "4,614.33",
          "val2": "3,880.54",
          "chgp": "18.91%",
          "chgp_class": "positive"
        },
        {
          "field": "Interest",
          "val1": "2,263.92",
          "val2": "1,866.12",
          "chgp": "21.32%",
          "chgp_class": "negative"
        },
        {
          "field": "Exceptional Items",
          "val1": "-40.00",
          "val2": "123.90",
          "chgp": "-132.28%",
          "chgp_class": "negative"
        },
        {
          "field": "Consolidate Net Profit",
          "val1": "1,366.84",
          "val2": "1,214.79",
          "chgp": "12.52%",
          "chgp_class": "positive"
        },
        {
          "field": "Operating Profit Margin (Excl OI)",
          "val1": "19.09%",
          "val2": "17.83%",
          "chgp": "1.26%",
          "chgp_class": "positive"
        }
      ]
    }
  },
  {
    "link": "nine-monthly",
    "btn_text": "All Nine Monthly Results",
    "header": "Nine Monthly Results Snapshot (Consolidated) - Dec'25",
    "rhs": [
      {
        "prefix": "Net Sales ",
        "suffix": "YoY Growth in nine months ended Dec 2025 is 15.59% vs 5.05% in Dec 2024",
        "dir": 1
      },
      {
        "prefix": "Consolidated Net Profit ",
        "suffix": "YoY Growth in nine months ended Dec 2025 is 10.30% vs 21.26% in Dec 2024",
        "dir": -1
      }
    ],
    "table": {
      "header": [
        "Dec'25",
        "Dec'24",
        "Change(%)"
      ],
      "body": [
        {
          "field": "Net Sales",
          "val1": "39,115.64",
          "val2": "33,839.59",
          "chgp": "15.59%",
          "chgp_class": "positive"
        },
        {
          "field": "Operating Profit (PBDIT) excl Other Income",
          "val1": "7,436.76",
          "val2": "6,216.83",
          "chgp": "19.62%",
          "chgp_class": "positive"
        },
        {
          "field": "Interest",
          "val1": "3,464.04",
          "val2": "2,877.39",
          "chgp": "20.39%",
          "chgp_class": "negative"
        },
        {
          "field": "Exceptional Items",
          "val1": "-365.16",
          "val2": "126.29",
          "chgp": "-389.14%",
          "chgp_class": "negative"
        },
        {
          "field": "Consolidate Net Profit",
          "val1": "2,180.33",
          "val2": "1,976.71",
          "chgp": "10.30%",
          "chgp_class": "positive"
        },
        {
          "field": "Operating Profit Margin (Excl OI)",
          "val1": "19.01%",
          "val2": "18.37%",
          "chgp": "0.64%",
          "chgp_class": "positive"
        }
      ]
    }
  },
  {
    "link": "annual",
    "btn_text": "All Annual Results",
    "header": "Annual Results Snapshot (Consolidated) - Mar'26",
    "rhs": [
      {
        "prefix": "Net Sales ",
        "suffix": "YoY Growth in year ended Mar 2026 is 16.13% vs 6.20% in Mar 2025",
        "dir": 1
      },
      {
        "prefix": "Consolidated Net Profit ",
        "suffix": "YoY Growth in year ended Mar 2026 is 11.72% vs 25.10% in Mar 2025",
        "dir": -1
      }
    ],
    "table": {
      "header": [
        "Mar'26",
        "Mar'25",
        "Change(%)"
      ],
      "body": [
        {
          "field": "Net Sales",
          "val1": "56,362.08",
          "val2": "48,535.14",
          "chgp": "16.13%",
          "chgp_class": "positive"
        },
        {
          "field": "Operating Profit (PBDIT) excl Other Income",
          "val1": "10,745.00",
          "val2": "9,207.75",
          "chgp": "16.70%",
          "chgp_class": "positive"
        },
        {
          "field": "Interest",
          "val1": "4,704.65",
          "val2": "3,930.21",
          "chgp": "19.70%",
          "chgp_class": "negative"
        },
        {
          "field": "Exceptional Items",
          "val1": "-384.44",
          "val2": "15.40",
          "chgp": "-2,596.36%",
          "chgp_class": "negative"
        },
        {
          "field": "Consolidate Net Profit",
          "val1": "3,471.03",
          "val2": "3,106.80",
          "chgp": "11.72%",
          "chgp_class": "positive"
        },
        {
          "field": "Operating Profit Margin (Excl OI)",
          "val1": "19.16%",
          "val2": "19.05%",
          "chgp": "0.11%",
          "chgp_class": "positive"
        }
      ]
    }
  }
]

Quarterly Results Snapshot (Consolidated) - Jun'26 - YoYstock-summary

Jun'26
Jun'25
Change(%)
Net Sales
13,069.59
11,708.54
11.62%
Operating Profit (PBDIT) excl Other Income
2,410.07
2,173.13
10.90%
Interest
1,340.60
1,111.90
20.57%
Exceptional Items
0.00
0.00
Consolidate Net Profit
615.81
611.07
0.78%
Operating Profit Margin (Excl OI)
18.51%
18.64%
-0.13%
Values in Rs Cr.
Direction Arrows
Net Sales

YoY Growth in quarter ended Jun 2026 is 11.62% vs 9.18% in Jun 2025

Direction Arrows
Consolidated Net Profit

YoY Growth in quarter ended Jun 2026 is 0.78% vs 20.02% in Jun 2025

Half Yearly Results Snapshot (Consolidated) - Sep'25stock-summary

Sep'25
Sep'24
Change(%)
Net Sales
24,285.40
21,844.38
11.17%
Operating Profit (PBDIT) excl Other Income
4,614.33
3,880.54
18.91%
Interest
2,263.92
1,866.12
21.32%
Exceptional Items
-40.00
123.90
-132.28%
Consolidate Net Profit
1,366.84
1,214.79
12.52%
Operating Profit Margin (Excl OI)
19.09%
17.83%
1.26%
Values in Rs Cr.
Direction Arrows
Net Sales

Growth in half year ended Sep 2025 is 11.17% vs 3.43% in Sep 2024

Direction Arrows
Consolidated Net Profit

Growth in half year ended Sep 2025 is 12.52% vs 13.54% in Sep 2024

Nine Monthly Results Snapshot (Consolidated) - Dec'25stock-summary

Dec'25
Dec'24
Change(%)
Net Sales
39,115.64
33,839.59
15.59%
Operating Profit (PBDIT) excl Other Income
7,436.76
6,216.83
19.62%
Interest
3,464.04
2,877.39
20.39%
Exceptional Items
-365.16
126.29
-389.14%
Consolidate Net Profit
2,180.33
1,976.71
10.30%
Operating Profit Margin (Excl OI)
19.01%
18.37%
0.64%
Values in Rs Cr.
Direction Arrows
Net Sales

YoY Growth in nine months ended Dec 2025 is 15.59% vs 5.05% in Dec 2024

Direction Arrows
Consolidated Net Profit

YoY Growth in nine months ended Dec 2025 is 10.30% vs 21.26% in Dec 2024

Annual Results Snapshot (Consolidated) - Mar'26stock-summary

Mar'26
Mar'25
Change(%)
Net Sales
56,362.08
48,535.14
16.13%
Operating Profit (PBDIT) excl Other Income
10,745.00
9,207.75
16.70%
Interest
4,704.65
3,930.21
19.70%
Exceptional Items
-384.44
15.40
-2,596.36%
Consolidate Net Profit
3,471.03
3,106.80
11.72%
Operating Profit Margin (Excl OI)
19.16%
19.05%
0.11%
Values in Rs Cr.
Direction Arrows
Net Sales

YoY Growth in year ended Mar 2026 is 16.13% vs 6.20% in Mar 2025

Direction Arrows
Consolidated Net Profit

YoY Growth in year ended Mar 2026 is 11.72% vs 25.10% in Mar 2025

stock-summaryCompany CV
About Ashok Leyland Ltd. stock-summary
stock-summary
Ashok Leyland Ltd.
Mid Cap
Automobiles
Ashok Leyland Ltd. is presently engaged in manufacture and sale of commercial vehicles. The Company manufacture engines for industrial and marine applications, forgings and casting. Its products include buses, trucks, engines, defense and special vehicles. From 18 seater to 82 seater double-decker buses, from 7.5 ton to 49 ton in haulage vehicles, from numerous special application vehicles to diesel engines for industrial, marine and genset applications, Ashok Leyland offers a range of products.
Company Coordinates stock-summary
Company Details
No 1 Sardar Patel Road, Guindy Chennai Tamil Nadu : 600032
stock-summary
Tel: 91-44-22206000
stock-summary
secretarial@ashokleyland.
Registrar Details
Integrated Enterprises (India) Ltd , II Floor , Kences Towers, No 1 Ramakrishna Street, North Usman Road, T Nagar, Chennai