Ashtasidhhi Ind

  • Market Cap: Micro Cap
  • Industry: Non Banking Financial Company (NBFC)
  • ISIN: INE373D01017
  • NSEID:
  • BSEID: 531341
INR
18.28
0.73 (4.16%)
BSENSE

May 26

BSE+NSE Vol: 3.33 k

  • Price Points
  • Score
  • Mojo Parameters
  • Total Return
  • News and Corporate Actions
  • Key factors
  • Shareholding
  • Financials
  • CompanyCV
stock-summaryPrice Point
High/Low

1Day

52 Week

Valuation
Technical
Day's Volume

CASH

3.33 k (74.75%) Volume

Shareholding (Mar 2026)

FII

0.00%

Held by 0 FIIs

DII

0.00%

Held by 0 DIIs

Promoter

58.07%

how big is Ashtasidhhi Ind?

06-Jun-2025

As of Jun 06, Ashtasidhhi Industries Ltd has a market capitalization of 10.36 Cr, with net sales of 1.53 Cr and net profit of 0.03 Cr over the latest four quarters. Shareholder's funds are 10.17 Cr, and total assets amount to 10.22 Cr as of the latest annual period ending in Mar'24.

Market Cap: As of Jun 06, the company name is Ashtasidhhi Industries Ltd, with a market capitalization of 10.36 Cr, classified as a Micro Cap.<BR><BR>Recent Quarterly Performance: For the latest 4 quarters, the sum of Net Sales is 1.53 Cr and the sum of Net Profit is 0.03 Cr. This data is presented on a Standalone basis.<BR><BR>Balance Sheet Snapshot: This is Standalone data for the latest annual period ending in Mar'24. The Shareholder's Funds are reported at 10.17 Cr, and the Total Assets amount to 10.22 Cr.

View full answer

What does Ashtasidhhi Ind do?

06-Jun-2025

Ashtasidhhi Industries Ltd is a Micro Cap NBFC company, originally incorporated in 1993 and rebranded in 2022, with recent quarterly results showing net sales and profit of 0 Cr. It has a market cap of Rs 10 Cr, a P/E ratio of 10.00, and no debt.

Overview:<BR>Ashtasidhhi Industries Ltd operates in the Non Banking Financial Company (NBFC) sector and is categorized as a Micro Cap company.<BR><BR>History:<BR>The company was originally incorporated in 1993 as Gujarat Investa Private Limited, later converted to a Limited Company in 1995, and rebranded to Ashtasidhhi Industries Limited on August 12, 2022. The most recent quarterly results reported net sales and net profit of 0 Cr for the period ending March 2025.<BR><BR>Financial Snapshot:<BR>- Net Sales: 0 Cr (Quarterly Results - Mar 2025)<BR>- Net Profit: 0 Cr (Quarterly Results - Mar 2025)<BR>- Market-cap: Rs 10 Cr (Micro Cap)<BR><BR>Key Metrics:<BR>- P/E: 10.00<BR>- Industry P/E: 23<BR>- Dividend Yield: 0.00%<BR>- Debt Equity: 0.00<BR>- Return on Equity: 0.30%<BR>- Price to Book: 0.97<BR><BR>Contact Details:<BR>Address: Office No 3 & 4 Shivalik Plaza, Opp Atira Ambawadi Ahmedabad Gujarat : 380015<BR>Tel: 91-079-26307831/7832<BR>Email: gujarat.investa@gmail.com<BR>Website: http://www.gujaratinvesta.com

View full answer

Who are in the management team of Ashtasidhhi Ind?

06-Jun-2025

As of March 2023, the management team of Ashtasidhhi Ind includes Purushottam R Agarwal (Chairman & Director), Pinky Mukesh Agarwal (CEO & Director), Anandkumar Agarwal (Independent Director), and Sumant Periwal (Independent Director). They are responsible for the company's governance and strategic direction.

As of March 2023, the management team of Ashtasidhhi Ind includes the following individuals:<BR><BR>1. Purushottam R Agarwal - Chairman & Director<BR>2. Pinky Mukesh Agarwal - CEO & Director<BR>3. Anandkumar Agarwal - Independent Director<BR>4. Sumant Periwal - Independent Director<BR><BR>These members play key roles in the governance and strategic direction of the company.

View full answer

Has Ashtasidhhi Ind declared dividend?

06-Jun-2025

No Dividend History Available

Who are the peers of the Ashtasidhhi Ind?

03-Jun-2025

Peers of Ashtasidhhi Ind include Bajaj Finance, Jio Financial, Cholaman.Inv.&Fn, Shriram Finance, Muthoot Finance, Octal Credit Cap, Siel Fin. Serv., and Guj. Lease Fin. Ashtasidhhi Ind has below-average management risk and growth, with a 1-year return of 18.69%, higher than Jio Financial's -20.22% but lower than Bajaj Finance's 30.39%.

Peers: The peers of Ashtasidhhi Ind are Bajaj Finance, Jio Financial, Cholaman.Inv.&Fn, Shriram Finance, Muthoot Finance, Octal Credit Cap, Siel Fin. Serv., Guj. Lease Fin.<BR><BR>Quality Snapshot: Excellent management risk is observed at Bajaj Finance, Cholaman.Inv.&Fn, and Muthoot Finance, while Average management risk is found at Jio Financial, Good management risk is seen at Shriram Finance, and Below Average management risk is noted for Ashtasidhhi Ind and Octal Credit Cap. Growth is Excellent at Jio Financial, Good at Bajaj Finance and Cholaman.Inv.&Fn, Average at Muthoot Finance, while Below Average growth is reported for Ashtasidhhi Ind and Octal Credit Cap. Capital Structure is Excellent at Bajaj Finance, Jio Financial, Shriram Finance, Muthoot Finance, and Octal Credit Cap, while Good is noted for Cholaman.Inv.&Fn, and Ashtasidhhi Ind has an Excellent capital structure.<BR><BR>Return Snapshot: The peer with the highest 1-year return is Bajaj Finance at 30.39%, while the lowest is Jio Financial at -20.22%. Ashtasidhhi Ind's 1-year return of 18.69% is higher than Jio Financial's but lower than Bajaj Finance's. Additionally, Octal Credit Cap, Siel Fin. Serv., and Guj. Lease Fin. have negative six-month returns.

View full answer

What is the technical trend for Ashtasidhhi Ind?

09-Jun-2025

As of June 2, 2025, Ashtasidhhi Ind is in a bearish trend with moderate strength, supported by bearish weekly MACD and moving averages, while mixed signals from the KST indicate varying trends across time frames.

As of 2 June 2025, the technical trend for Ashtasidhhi Ind has changed from mildly bearish to bearish. The current stance is bearish with a moderate strength. Key indicators driving this assessment include the weekly MACD, which is bearish, and the daily moving averages, also bearish. The Bollinger Bands are bearish on both weekly and monthly time frames, reinforcing the negative sentiment. The KST shows a bearish signal on the weekly but is bullish on the monthly, indicating mixed signals over different time frames. Overall, the technical indicators suggest a prevailing bearish trend in the near term.

View full answer

Who are the top shareholders of the Ashtasidhhi Ind?

17-Jul-2025

The top shareholder of Ashtasidhhi Ind is Anjani R Agarwal, holding 24.91%, with no pledged promoter holdings. The highest public shareholder is Veensan Fabrics Private Limited at 3.73%, while individual investors collectively own 27.26% of the shares.

The top shareholders of Ashtasidhhi Ind include the promoters, with Anjani R Agarwal holding the highest stake at 24.91%. There are no pledged promoter holdings, and the company does not have any mutual funds or foreign institutional investors (FIIs) holding shares. The highest public shareholder is Veensan Fabrics Private Limited, which holds 3.73%. Additionally, individual investors collectively hold 27.26% of the shares.

View full answer

Is Ashtasidhhi Ind overvalued or undervalued?

17-Nov-2025

As of November 14, 2025, Ashtasidhhi Ind is considered very expensive and overvalued with a PE ratio of 1600.36, an EV to EBITDA of -15.93, and a PEG ratio of 15.61, significantly higher than its peers, despite a 1-year return of 26.62% that does not justify its valuation.

As of 14 November 2025, the valuation grade for Ashtasidhhi Ind has moved from risky to very expensive. The company is currently overvalued, with a staggering PE ratio of 1600.36, an EV to EBITDA of -15.93, and a PEG ratio of 15.61. These figures indicate a significant disconnect between the company’s market price and its underlying financial performance.<BR><BR>In comparison to its peers, Ashtasidhhi Ind's valuation metrics are notably higher; for instance, Bajaj Finance has a PE ratio of 34.62 and an EV to EBITDA of 19.53, while Life Insurance boasts a much lower PE of 11.25 and an EV to EBITDA of 9.29. The company's recent stock performance shows a 1-year return of 26.62%, outperforming the Sensex's 9.00%, but this does not justify its current valuation levels. Overall, Ashtasidhhi Ind appears to be significantly overvalued in the context of its financial ratios and peer comparisons.

View full answer

How has been the historical performance of Ashtasidhhi Ind?

02-Dec-2025

Ashtasidhhi Ind has shown significant growth in net sales from 0.29 Cr in Mar'23 to 1.56 Cr in Mar'25, with a recovery in profitability despite rising expenditures. However, the company still faces liquidity challenges, as cash flow from operating activities remains stagnant.

Answer:<BR>The historical performance of Ashtasidhhi Ind shows a fluctuating trend in net sales and profitability over the years, with significant growth observed in the most recent fiscal year.<BR><BR>Breakdown:<BR>Ashtasidhhi Ind's net sales have increased from 0.29 Cr in Mar'23 to 1.56 Cr in Mar'25, indicating a strong upward trend. The total operating income also rose from 0.29 Cr in Mar'23 to 1.56 Cr in Mar'25. However, the company faced challenges with total expenditure, which increased from 0.24 Cr in Mar'23 to 1.52 Cr in Mar'25, leading to an operating profit of only 0.04 Cr in Mar'25, a recovery from a loss of 0.58 Cr in Mar'24. Profit before tax showed a similar pattern, moving from a profit of 0.05 Cr in Mar'23 to 0.04 Cr in Mar'25, after a loss in the previous year. The profit after tax was 0.03 Cr in Mar'25, recovering from a loss of 0.39 Cr in Mar'24. The company's total assets increased slightly from 10.61 Cr in Mar'23 to 10.63 Cr in Mar'25, while total liabilities also rose from 10.22 Cr to 10.63 Cr in the same period. Cash flow from operating activities remained stagnant at 0.00 Cr, reflecting ongoing liquidity challenges. Overall, while Ashtasidhhi Ind has shown growth in sales and some recovery in profitability, it continues to face significant expenditure pressures and liquidity issues.

View full answer

Are Ashtasidhhi Industries Ltd latest results good or bad?

07-Feb-2026

Ashtasidhhi Industries Ltd's latest results show a slight profit improvement with a net profit of ₹0.01 crore and better operating margins, but a significant revenue decline of 87.92% quarter-on-quarter raises concerns about the company's stability. Overall, while there are positive signs, the severe drop in revenue suggests underlying business challenges that investors should consider.

The latest results for Ashtasidhhi Industries Ltd present a mixed picture. On one hand, the company reported a net profit of ₹0.01 crore in Q2 FY26, which is an improvement from breakeven in the previous quarter. This indicates a positive shift in profitability. Additionally, the operating margin improved significantly to 5.56% from a negative margin in Q1 FY26, suggesting better cost management.<BR><BR>However, the revenue figures are concerning. The company experienced a dramatic decline in revenue, dropping 87.92% quarter-on-quarter to ₹0.18 crore, and a 55% decrease year-on-year from ₹0.40 crore in Q2 FY25. This extreme volatility raises questions about the sustainability of its business model and operational stability.<BR><BR>Overall, while there are some positive signs in terms of profitability and operating margins, the severe revenue decline and the company's overall operational fragility overshadow these improvements. Investors should be cautious, as the underlying business challenges remain significant.

View full answer

When is the next results date for Ashtasidhhi Industries Ltd?

26-May-2026

The next results date for Ashtasidhhi Industries Ltd is 28 May 2026.

The next results date for Ashtasidhhi Industries Ltd is scheduled for 28 May 2026.

View full answer

Should I buy, sell or hold Ashtasidhhi Industries Ltd?

27-May-2026

Why is Ashtasidhhi Industries Ltd falling/rising?

27-May-2026

As of 26-May, Ashtasidhhi Industries Ltd's stock price is currently at 18.28, showing a 4.16% increase after two days of decline. However, it has underperformed over the past week and month, and trading volume has significantly decreased, indicating ongoing pressure on the stock.

As of 26-May, Ashtasidhhi Industries Ltd's stock price is rising, currently at 18.28, reflecting a change of 0.73 or 4.16% increase. This upward movement comes after two consecutive days of decline, indicating a potential trend reversal. Additionally, the stock has outperformed its sector by 4.48% today, which may contribute to the positive sentiment among investors.<BR><BR>However, it is important to note that despite the current rise, the stock has been underperforming in the longer term. Over the past week, it has decreased by 0.76%, and over the past month, it has fallen by 12.20%. Furthermore, the stock is trading below its 5-day, 20-day, 50-day, 100-day, and 200-day moving averages, which typically suggests a bearish trend. <BR><BR>Investor participation has also declined significantly, with delivery volume on 25 May dropping by 95.41% compared to the 5-day average, indicating reduced interest in trading the stock. Despite the current rise, these factors suggest that the stock's overall performance remains under pressure.

View full answer
iScoreScore
Click here to find our call on this stock
Strong Sell
Sell
Hold
Buy
Strong Buy

Dashboard

1

Weak Long Term Fundamental Strength with an average Return on Equity (ROE) of 0.90%

  • Poor long term growth as Operating profit has grown by an annual rate of -5.59%
2

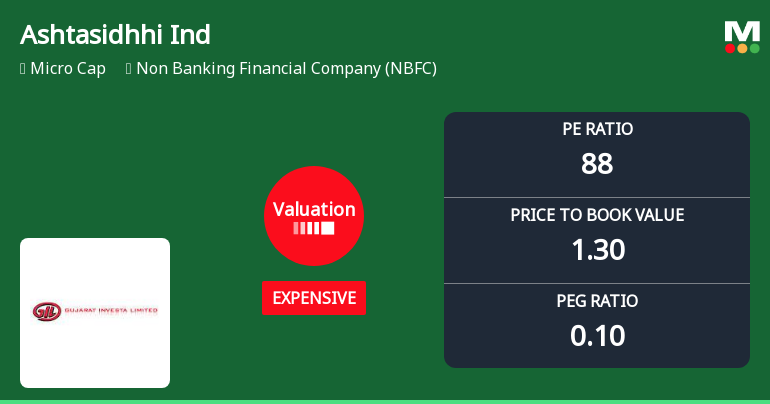
With ROE of 0.9, it has a Very Expensive valuation with a 1.3 Price to Book Value

stock-summaryMojo Parameters

Mojo Parameters

Loading Valuation Snapshot...

Stock DNA

stock-summary
Industry

Non Banking Financial Company (NBFC)

stock-summary
Market cap

INR 13 Cr (Micro Cap)

stock-summary
P/E

153.00

stock-summary
Industry P/E

21

stock-summary
Dividend Yield

0.00%

stock-summary
Debt Equity

0.00

stock-summary
Return on Equity

0.88%

stock-summary
Price to Book

1.29

Revenue and Profits:
Net Sales:
4 Cr
(Quarterly Results - Dec 2025)
Net Profit:
0 Cr
stock-summaryTotal Returns
Total Returns (Price + Dividend) stock-summary
Dividend Yield (0%)
TimePeriod
Price Return
Dividend Return
Total Return
3 Months
-13.41%
0%
-13.41%
6 Months
-14.1%
0%
-14.1%
1 Year
3.98%
0%
3.98%
2 Years
40.62%
0%
40.62%
3 Years
48.62%
0%
48.62%
4 Years
194.84%
0%
194.84%
5 Years
0%
0%
0.0%

Ashtasidhhi Ind for the last several years.

Risk Adjusted Returns v/s stock-summary
Returns Beta
Icon
Beta has not been calculated since enough price history is not available
stock-summaryNews & Corporate Actions

Announcements stock-summary

Board Meeting Intimation for To Consider And Approve The Standalone Audited Financial Results Of The Company For The Quarter And Financial Year Ended On 31St March 2026.

25-May-2026 | Source : BSE

Gujarat Investa Ltdhas informed BSE that the meeting of the Board of Directors of the Company is scheduled on 28/05/2026 inter alia to consider and approve 1. the Standalone Audited Financial Results of the Company for the Quarter and Financial Year ended on 31st March 2026. 2. To Consider and discuss any other matter /business with the permission of the chairman.

Format of the Annual Disclosure to be made by an entity identified as a LC - Annexure B2

13-May-2026 | Source : BSE

Format of the Annual Disclosure to be made by an entity identified as a Large Corporate.

Sr. No. Particulars Details
1 Name of Company Gujarat Investa Ltd
2 CIN NO. L17100GJ1993PLC018858
3 Report filed for FY 2025-2026
Details of the Current block (all figures in Rs crore):
4 2 - year block period (Specify financial years)* 0
5 Incremental borrowing done in FY (T)(a) 0.00
6 Mandatory borrowing to be done through debt securities in FY (T) (b) = (25% of a) 0.00
7 Actual borrowing done through debt securities in FY (T)(c) 0.00
8 Shortfall in the borrowing through debt securities if any for FY (T - 1) carried forward to FY (T) (d) 0
8Quantum of (d) which has been met from (c)(e)* 0
9 Shortfall if any in the mandatory borrowing through debt securities for FY (T) { after adjusting for any shortfall in borrowing for FY(T - 1) which was carried forward to FY(T)}(f) = (b) - [(c) - (e)]{ If the calculated value is zero or negative write nil}* 0


Details of penalty to be paid if any in respect to previous block (all figures in Rs crore):
2 - year Block period (Specify financial years)NA
Amount of fine to be paid for the block if applicable Fine = 0.2% of {(d) - (e)}#0.00


Name of the Company Secretary :-VAISHALIBEN SANJAYBHAI JAIN
Designation :-COMPANY SECRETARY
Name of the Chief Financial Officer :- DEEPARAM REBARI
Designation : -CHIEF FINANCIAL OFFICER

Date: 13/05/2026

Format of the Initial Disclosure to be made by an entity identified as a Large Corporate : Annexure A

13-May-2026 | Source : BSE

Format of Initial Disclosure to be made by an entity identified as a Large Corporate.

Sr. No. Particulars Details
1Name of CompanyGujarat Investa Ltd
2CIN NO.L17100GJ1993PLC018858
3 Outstanding borrowing of company as on 31st March / 31st December as applicable (in Rs cr) 0.02
4Highest Credit Rating during the previous FY NA
4aName of the Credit Rating Agency issuing the Credit Rating mentioned in (4)Not Applicable
5Name of Stock Exchange# in which the fine shall be paid in case of shortfall in the required borrowing under the frameworkBSE


We confirm that we are a Large Corporate as per the applicability criteria given under the SEBI circular SEBI/HO/DDHS/CIR/P/2018/144 dated November 26 2018. No


Name of the Company Secretary: VAISHALIBEN SANJAYBHAI JAIN
Designation: COMPANY SECRETARY
EmailId: gujarat.investa@gmail.com
Name of the Chief Financial Officer: DEEPARAM REBARI
Designation: CHIEF FINANCIAL OFFICER
EmailId: gujarat.investa@gmail.com

Date: 13/05/2026

Note: In terms para of 3.2(ii) of the circular beginning F.Y 2022 in the event of shortfall in the mandatory borrowing through debt securities a fine of 0.2% of the shortfall shall be levied by Stock Exchanges at the end of the two-year block period. Therefore an entity identified as LC shall provide in its initial disclosure for a financial year the name of Stock Exchange to which it would pay the fine in case of shortfall in the mandatory borrowing through debt markets.

Corporate Actions stock-summary

stock-summary
BOARD MEETING

28 May 2026

stock-summary
DIVIDEND

No Dividend history available

stock-summary
SPLITS

No Splits history available

stock-summary
BONUS

No Bonus history available

stock-summary
RIGHTS

No Rights history available

stock-summaryKey Factors

Quality key factors stock-summary

Factor
Value
Sales Growth (5y)
44.68%
EBIT Growth (5y)
-5.59%
Net Debt to Equity (avg)
0
Institutional Holding
0
ROE (avg)
0.90%

Valuation key factors

Factor
Value
P/E Ratio
153
Industry P/E
21
Price to Book Value
1.35
EV to EBIT
13.66
EV to EBITDA
13.66
EV to Capital Employed
1.35
EV to Sales
2.36
PEG Ratio
1.25
Dividend Yield
NA
ROCE (Latest)
0.10%
ROE (Latest)
0.88%

Technicals key factors

Indicator
Weekly
Monthly
MACD
Bearish
Mildly Bearish
RSI
No Signal
No Signal
Bollinger Bands
Bearish
Mildly Bullish
Moving Averages
Mildly Bullish (Daily)
KST
Bearish
Mildly Bearish
Dow Theory
Mildly Bearish
Mildly Bearish
stock-summary Technical Indicator Scale: Bearish, Mildly Bearish, Sideways, Mildly Bullish, Bullish  Turned 
stock-summaryShareholding
Shareholding Snapshot : Mar 2026stock-summary
Shareholding Compare (%holding) stock-summary
Majority shareholders

Promoters

Pledged Promoter Holdings

None

Mutual Funds

Held by 0 Schemes

FIIs

Held by 0 FIIs

Promoter with highest holding

Anjani Radheshyam Agarwal (24.91%)

Highest Public shareholder

Devkirani Rampurshottam Agarwal (6.98%)

Individual Investors Holdings

27.25%

stock-summaryFinancial
[
  {
    "link": "quarterly",
    "btn_text": "All Quarterly Results",
    "header": "Quarterly Results Snapshot (Standalone) - Dec'25 - YoY",
    "rhs": [
      {
        "prefix": "Net Sales ",
        "suffix": "YoY Growth in quarter ended Dec 2025 is 756.82% vs 300.00% in Dec 2024",
        "dir": 1
      },
      {
        "prefix": "Standalone Net Profit ",
        "suffix": "YoY Growth in quarter ended Dec 2025 is 800.00% vs 0.00% in Dec 2024",
        "dir": 1
      }
    ],
    "table": {
      "header": [
        "Dec'25",
        "Dec'24",
        "Change(%)"
      ],
      "body": [
        {
          "field": "Net Sales",
          "val1": "3.77",
          "val2": "0.44",
          "chgp": "756.82%",
          "chgp_class": "positive"
        },
        {
          "field": "Operating Profit (PBDIT) excl Other Income",
          "val1": "0.05",
          "val2": "-0.01",
          "chgp": "600.00%",
          "chgp_class": "positive"
        },
        {
          "field": "Interest",
          "val1": "0.00",
          "val2": "0.00",
          "chgp": "",
          "chgp_class": "neutral"
        },
        {
          "field": "Exceptional Items",
          "val1": "0.00",
          "val2": "0.00",
          "chgp": "",
          "chgp_class": "neutral"
        },
        {
          "field": "Standalone Net Profit",
          "val1": "0.07",
          "val2": "-0.01",
          "chgp": "800.00%",
          "chgp_class": "positive"
        },
        {
          "field": "Operating Profit Margin (Excl OI)",
          "val1": "1.33%",
          "val2": "-2.27%",
          "chgp": "3.60%",
          "chgp_class": "positive"
        }
      ]
    }
  },
  {
    "link": "half-yearly",
    "btn_text": "All Half Yearly Results",
    "header": "Half Yearly Results Snapshot (Standalone) - Sep'25",
    "rhs": [
      {
        "prefix": "Net Sales ",
        "suffix": " Growth in half year ended Sep 2025 is 118.18% vs 381.25% in Sep 2024",
        "dir": -1
      },
      {
        "prefix": "Standalone Net Profit ",
        "suffix": " Growth in half year ended Sep 2025 is -33.33% vs -25.00% in Sep 2024",
        "dir": -1
      }
    ],
    "table": {
      "header": [
        "Sep'25",
        "Sep'24",
        "Change(%)"
      ],
      "body": [
        {
          "field": "Net Sales",
          "val1": "1.68",
          "val2": "0.77",
          "chgp": "118.18%",
          "chgp_class": "positive"
        },
        {
          "field": "Operating Profit (PBDIT) excl Other Income",
          "val1": "0.00",
          "val2": "0.04",
          "chgp": "-100.00%",
          "chgp_class": "negative"
        },
        {
          "field": "Interest",
          "val1": "0.00",
          "val2": "0.00",
          "chgp": "",
          "chgp_class": "neutral"
        },
        {
          "field": "Exceptional Items",
          "val1": "0.00",
          "val2": "0.00",
          "chgp": "",
          "chgp_class": "neutral"
        },
        {
          "field": "Standalone Net Profit",
          "val1": "0.02",
          "val2": "0.03",
          "chgp": "-33.33%",
          "chgp_class": "negative"
        },
        {
          "field": "Operating Profit Margin (Excl OI)",
          "val1": "0.00%",
          "val2": "5.19%",
          "chgp": "-5.19%",
          "chgp_class": "negative"
        }
      ]
    }
  },
  {
    "link": "nine-monthly",
    "btn_text": "All Nine Monthly Results",
    "header": "Nine Monthly Results Snapshot (Standalone) - Dec'25",
    "rhs": [
      {
        "prefix": "Net Sales ",
        "suffix": "YoY Growth in nine months ended Dec 2025 is 350.41% vs 348.15% in Dec 2024",
        "dir": 1
      },
      {
        "prefix": "Standalone Net Profit ",
        "suffix": "YoY Growth in nine months ended Dec 2025 is 350.00% vs -33.33% in Dec 2024",
        "dir": 1
      }
    ],
    "table": {
      "header": [
        "Dec'25",
        "Dec'24",
        "Change(%)"
      ],
      "body": [
        {
          "field": "Net Sales",
          "val1": "5.45",
          "val2": "1.21",
          "chgp": "350.41%",
          "chgp_class": "positive"
        },
        {
          "field": "Operating Profit (PBDIT) excl Other Income",
          "val1": "0.05",
          "val2": "0.03",
          "chgp": "66.67%",
          "chgp_class": "positive"
        },
        {
          "field": "Interest",
          "val1": "0.00",
          "val2": "0.00",
          "chgp": "",
          "chgp_class": "neutral"
        },
        {
          "field": "Exceptional Items",
          "val1": "0.00",
          "val2": "0.00",
          "chgp": "",
          "chgp_class": "neutral"
        },
        {
          "field": "Standalone Net Profit",
          "val1": "0.09",
          "val2": "0.02",
          "chgp": "350.00%",
          "chgp_class": "positive"
        },
        {
          "field": "Operating Profit Margin (Excl OI)",
          "val1": "0.92%",
          "val2": "2.48%",
          "chgp": "-1.56%",
          "chgp_class": "negative"
        }
      ]
    }
  },
  {
    "link": "annual",
    "btn_text": "All Annual Results",
    "header": "Annual Results Snapshot (Standalone) - Mar'25",
    "rhs": [
      {
        "prefix": "Net Sales ",
        "suffix": "YoY Growth in year ended Mar 2025 is 164.41% vs 103.45% in Mar 2024",
        "dir": 1
      },
      {
        "prefix": "Standalone Net Profit ",
        "suffix": "YoY Growth in year ended Mar 2025 is 107.69% vs -1,075.00% in Mar 2024",
        "dir": 1
      }
    ],
    "table": {
      "header": [
        "Mar'25",
        "Mar'24",
        "Change(%)"
      ],
      "body": [
        {
          "field": "Net Sales",
          "val1": "1.56",
          "val2": "0.59",
          "chgp": "164.41%",
          "chgp_class": "positive"
        },
        {
          "field": "Operating Profit (PBDIT) excl Other Income",
          "val1": "0.04",
          "val2": "-0.58",
          "chgp": "106.90%",
          "chgp_class": "positive"
        },
        {
          "field": "Interest",
          "val1": "0.00",
          "val2": "0.00",
          "chgp": "",
          "chgp_class": "neutral"
        },
        {
          "field": "Exceptional Items",
          "val1": "0.00",
          "val2": "0.00",
          "chgp": "",
          "chgp_class": "neutral"
        },
        {
          "field": "Standalone Net Profit",
          "val1": "0.03",
          "val2": "-0.39",
          "chgp": "107.69%",
          "chgp_class": "positive"
        },
        {
          "field": "Operating Profit Margin (Excl OI)",
          "val1": "2.56%",
          "val2": "-98.31%",
          "chgp": "100.87%",
          "chgp_class": "positive"
        }
      ]
    }
  }
]

Quarterly Results Snapshot (Standalone) - Dec'25 - YoYstock-summary

Dec'25
Dec'24
Change(%)
Net Sales
3.77
0.44
756.82%
Operating Profit (PBDIT) excl Other Income
0.05
-0.01
600.00%
Interest
0.00
0.00
Exceptional Items
0.00
0.00
Standalone Net Profit
0.07
-0.01
800.00%
Operating Profit Margin (Excl OI)
1.33%
-2.27%
3.60%
Values in Rs Cr.
Direction Arrows
Net Sales

YoY Growth in quarter ended Dec 2025 is 756.82% vs 300.00% in Dec 2024

Direction Arrows
Standalone Net Profit

YoY Growth in quarter ended Dec 2025 is 800.00% vs 0.00% in Dec 2024

Half Yearly Results Snapshot (Standalone) - Sep'25stock-summary

Sep'25
Sep'24
Change(%)
Net Sales
1.68
0.77
118.18%
Operating Profit (PBDIT) excl Other Income
0.00
0.04
-100.00%
Interest
0.00
0.00
Exceptional Items
0.00
0.00
Standalone Net Profit
0.02
0.03
-33.33%
Operating Profit Margin (Excl OI)
0.00%
5.19%
-5.19%
Values in Rs Cr.
Direction Arrows
Net Sales

Growth in half year ended Sep 2025 is 118.18% vs 381.25% in Sep 2024

Direction Arrows
Standalone Net Profit

Growth in half year ended Sep 2025 is -33.33% vs -25.00% in Sep 2024

Nine Monthly Results Snapshot (Standalone) - Dec'25stock-summary

Dec'25
Dec'24
Change(%)
Net Sales
5.45
1.21
350.41%
Operating Profit (PBDIT) excl Other Income
0.05
0.03
66.67%
Interest
0.00
0.00
Exceptional Items
0.00
0.00
Standalone Net Profit
0.09
0.02
350.00%
Operating Profit Margin (Excl OI)
0.92%
2.48%
-1.56%
Values in Rs Cr.
Direction Arrows
Net Sales

YoY Growth in nine months ended Dec 2025 is 350.41% vs 348.15% in Dec 2024

Direction Arrows
Standalone Net Profit

YoY Growth in nine months ended Dec 2025 is 350.00% vs -33.33% in Dec 2024

Annual Results Snapshot (Standalone) - Mar'25stock-summary

Mar'25
Mar'24
Change(%)
Net Sales
1.56
0.59
164.41%
Operating Profit (PBDIT) excl Other Income
0.04
-0.58
106.90%
Interest
0.00
0.00
Exceptional Items
0.00
0.00
Standalone Net Profit
0.03
-0.39
107.69%
Operating Profit Margin (Excl OI)
2.56%
-98.31%
100.87%
Values in Rs Cr.
Direction Arrows
Net Sales

YoY Growth in year ended Mar 2025 is 164.41% vs 103.45% in Mar 2024

Direction Arrows
Standalone Net Profit

YoY Growth in year ended Mar 2025 is 107.69% vs -1,075.00% in Mar 2024

stock-summaryCompany CV
About Ashtasidhhi Industries Ltd stock-summary
stock-summary
Ashtasidhhi Industries Ltd
Micro Cap
Non Banking Financial Company (NBFC)
Ashtasidhhi Industries Limited which was originally incorporated as a Private Limited Company in the name & style of 'Gujarat Investa Private Limited' on 22 January, 1993 was converted into a Limited Company. The name of the Company was subsequently changed to Gujarat Investa Limited with Registrar of Companies, Ahmedabad on 15 February, 1995. Thereafter, the name was later changed to Ashtasidhhi Industries Limited on August 12, 2022.
Company Coordinates stock-summary
Company Details
Office No 3 & 4 Shivalik Plaza, Opp Atira Ambawadi Ahmedabad Gujarat : 380015
stock-summary
Tel: 91-079-26307831/7832
stock-summary
gujarat.investa@gmail.com
Registrar Details
Bigshare Services Pvt Ltd , E-2 , Ansa Industrial Estate, Saki Vihar Road, Saki Naka, Andheri (E), Mumbai