
Compare Asian Granito with Similar Stocks
Dashboard
With a Operating Losses, the company has a Weak Long Term Fundamental Strength
- Company's ability to service its debt is weak with a poor EBIT to Interest (avg) ratio of 0.25
- The company has been able to generate a Return on Equity (avg) of 2.17% signifying low profitability per unit of shareholders funds
- PBT LESS OI(Q) At Rs -46.48 cr has Fallen at -260.87%
- PAT(Q) At Rs -31.89 cr has Fallen at -739.2%
- INTEREST(Latest six months) At Rs 17.75 cr has Grown at 24.47%
Below par performance in long term as well as near term
Stock DNA
Diversified consumer products
INR 1,808 Cr (Micro Cap)
144.00
30
0.00%
0.23
0.81%
1.15
Total Returns (Price + Dividend) 
Latest dividend: 0.7 per share ex-dividend date: Jun-09-2022
Risk Adjusted Returns v/s
Returns Beta

News
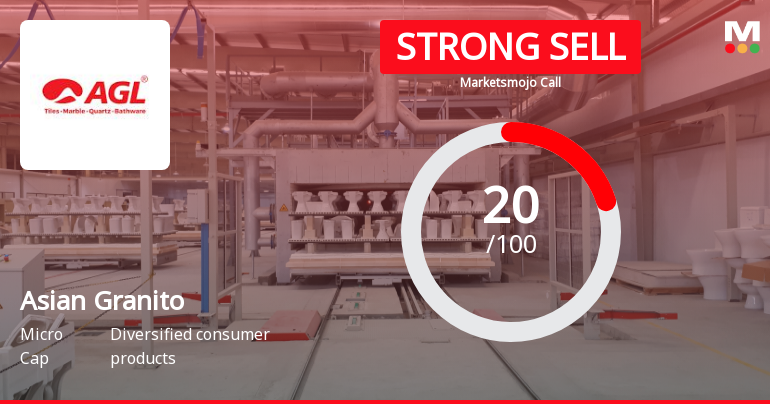
Asian Granito India Ltd is Rated Strong Sell
Asian Granito India Ltd is rated Strong Sell by MarketsMOJO, with this rating last updated on 01 June 2026. However, the analysis and financial metrics discussed here reflect the stock’s current position as of 04 June 2026, providing investors with an up-to-date view of the company’s fundamentals, valuation, financial trends, and technical outlook.
Read full news article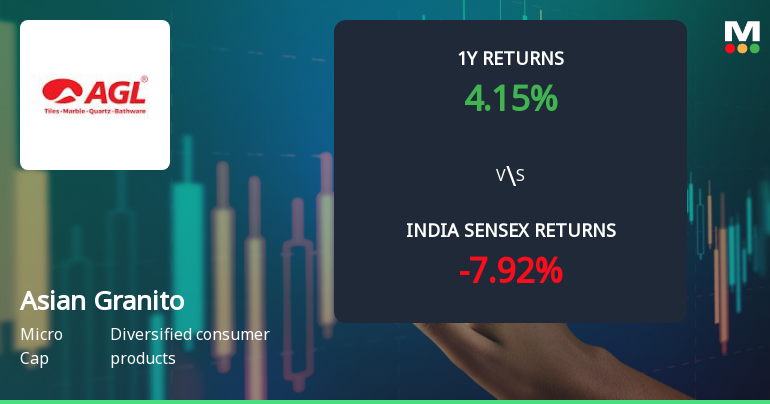
Asian Granito India Ltd Faces Bearish Momentum Amid Technical Downturn
Asian Granito India Ltd, a micro-cap player in the diversified consumer products sector, has seen a notable shift in its technical momentum, moving from a mildly bearish stance to a more pronounced bearish trend. Recent technical indicators including MACD, RSI, and moving averages signal increasing downside pressure, reflecting the stock’s underperformance relative to the broader market benchmarks.
Read full news article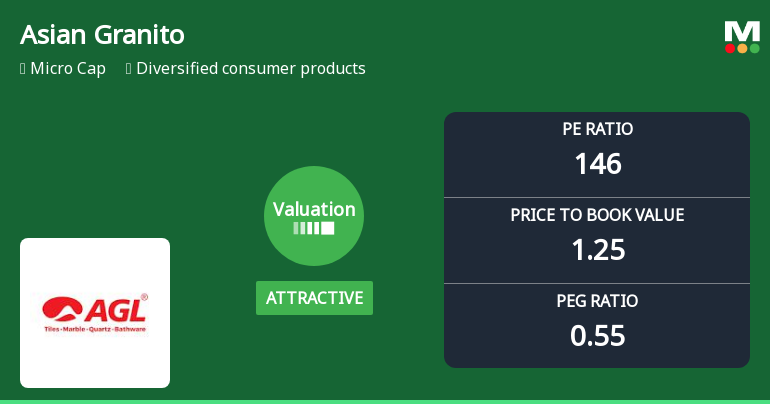
Asian Granito India Ltd Valuation Shifts to Attractive Amid Mixed Market Returns
Asian Granito India Ltd has experienced a notable shift in its valuation parameters, moving from a very attractive to an attractive rating. Despite a lofty price-to-earnings (P/E) ratio of 146.15, the company’s price-to-book value (P/BV) and other metrics suggest a nuanced picture of price attractiveness amid challenging sector dynamics and mixed financial performance.
Read full news article Announcements
Report From The Audit Committee And Independent Directors Of The Company Certifying Distribution Of Proceeds To Eligible Shareholders Of Fractional Shares Pursuant To The Composite Scheme Of Arrangement.
05-Jun-2026 | Source : BSEReport of the Audit Committee and Independent Directors.
Announcement under Regulation 30 (LODR)-Press Release / Media Release
01-Jun-2026 | Source : BSEPlease find Media Release
Announcement under Regulation 30 (LODR)-Diversification / Disinvestment
30-May-2026 | Source : BSE1. Disinvestment from AGL Proteins Private Limited 2. Disinvestment from Allomex Steel Private Limited
Corporate Actions

No Upcoming Board Meetings

Asian Granito India Ltd has declared 7% dividend, ex-date: 09 Jun 22

No Splits history available

No Bonus history available

Asian Granito India Ltd has announced 37:30 rights issue, ex-date: 11 Apr 22
Quality key factors
Valuation key factors
Technicals key factors
 Technical Indicator Scale: Bearish, Mildly Bearish, Sideways, Mildly Bullish, Bullish Turned
 Shareholding Snapshot : Mar 2026
Shareholding Compare (%holding)
Non Institution
None
Held by 0 Schemes
Held by 27 FIIs (1.15%)
Kamleshkumar Bhagubhai Patel (4.22%)
L7 Hitech Private Limited (6.37%)
48.44%
Quarterly Results Snapshot (Consolidated) - Mar'26 - YoY

YoY Growth in quarter ended Mar 2026 is 4.61% vs 21.51% in Mar 2025
YoY Growth in quarter ended Mar 2026 is -739.21% vs -61.70% in Mar 2025
Half Yearly Results Snapshot (Consolidated) - Sep'25

Growth in half year ended Sep 2025 is 9.39% vs -1.20% in Sep 2024
Growth in half year ended Sep 2025 is 184.89% vs 325.41% in Sep 2024
Nine Monthly Results Snapshot (Consolidated) - Dec'25
YoY Growth in nine months ended Dec 2025 is 14.99% vs -1.26% in Dec 2024
YoY Growth in nine months ended Dec 2025 is 1,061.42% vs 138.45% in Dec 2024
Annual Results Snapshot (Consolidated) - Mar'26
YoY Growth in year ended Mar 2026 is 8.60% vs 11.79% in Mar 2025
YoY Growth in year ended Mar 2026 is 99.14% vs 185.55% in Mar 2025
About Asian Granito India Ltd

Company Coordinates


