
Compare Virtuoso Optoel. with Similar Stocks
Dashboard
Healthy long term growth as Net Sales has grown by an annual rate of 42.90%
Flat results in Mar 26
With ROCE of 7.5, it has a Very Expensive valuation with a 2.7 Enterprise value to Capital Employed
Despite the size of the company, domestic mutual funds hold only 0% of the company
Consistent Returns over the last 3 years
Stock DNA
Diversified consumer products
INR 1,519 Cr (Micro Cap)
108.00
63
0.00%
0.81
3.90%
3.68
Total Returns (Price + Dividend) 
Virtuoso Optoel. for the last several years.
Risk Adjusted Returns v/s
Returns Beta

News

Virtuoso Optoelectronics Ltd is Rated Sell
Virtuoso Optoelectronics Ltd is rated Sell by MarketsMOJO, with this rating last updated on 13 July 2026. However, the analysis and financial metrics presented here reflect the stock’s current position as of 16 July 2026, providing investors with the latest insights into its performance and outlook.
Read full news article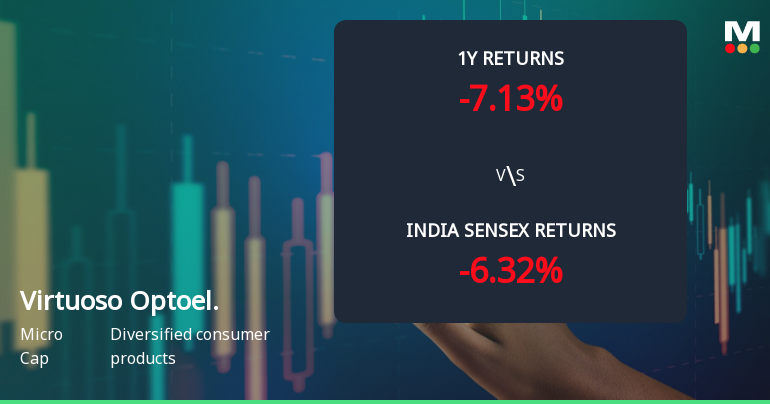
Virtuoso Optoelectronics Ltd Shows Mixed Technical Signals Amid Mildly Bullish Momentum
Virtuoso Optoelectronics Ltd, a micro-cap player in the diversified consumer products sector, has experienced a notable shift in its technical momentum from sideways to mildly bullish. Despite a recent downgrade in its Mojo Grade from Hold to Sell, the stock’s price action and technical indicators reveal a complex picture of emerging strength tempered by cautionary signals.
Read full news article
Virtuoso Optoelectronics Ltd Faces Mixed Technical Signals Amid Price Momentum Shift
Virtuoso Optoelectronics Ltd, a micro-cap player in the diversified consumer products sector, has experienced a notable shift in its technical momentum, reflecting a complex interplay of bullish and bearish signals across multiple timeframes. The stock’s recent downgrade from Hold to Sell by MarketsMOJO, accompanied by a 2.53% decline in daily price, underscores the evolving market sentiment and technical landscape investors must carefully analyse.
Read full news article Announcements
Shareholder Meeting / Postal Ballot-Scrutinizers Report
13-Jul-2026 | Source : BSESubmission of Voting Result and Scrutinizers Report
Shareholder Meeting / Postal Ballot-Outcome of EGM
12-Jul-2026 | Source : BSEProceedings of 01/2026-27 Extra Ordinary General Meeting of the Company
Announcement under Regulation 30 (LODR)-Analyst / Investor Meet - Intimation
09-Jul-2026 | Source : BSEManagement of the Company will be interacting with the Dolat Capital (Institutional Broking)
Corporate Actions

No Upcoming Board Meetings

No Dividend history available

No Splits history available

No Bonus history available

No Rights history available
Quality key factors
Valuation key factors
Technicals key factors
 Technical Indicator Scale: Bearish, Mildly Bearish, Sideways, Mildly Bullish, Bullish Turned
 Shareholding Snapshot : Jun 2026
Shareholding Compare (%holding)
Promoters
None
Held by 0 Schemes
Held by 4 FIIs (11.29%)
Sukrit Arvind Bharati (47.93%)
Malabar India Fund Limited (7.91%)
30.03%
Quarterly Results Snapshot (Standalone) - Mar'26 - QoQ

QoQ Growth in quarter ended Mar 2026 is 61.97% vs 110.72% in Dec 2025
QoQ Growth in quarter ended Mar 2026 is -22.41% vs 312.99% in Dec 2025
Half Yearly Results Snapshot (Consolidated) - Sep'25
Growth in half year ended Sep 2025 is -22.43% vs 27.13% in Mar 2025
Growth in half year ended Sep 2025 is -53.90% vs -26.14% in Mar 2025
Nine Monthly Results Snapshot (Consolidated) - Dec'25
YoY Growth in nine months ended Dec 2025 is -18.53% vs 12.03% in Mar 2026
YoY Growth in nine months ended Dec 2025 is -11.25% vs 49.81% in Mar 2026
Annual Results Snapshot (Consolidated) - Mar'26
YoY Growth in year ended Mar 2026 is 17.83% vs 31.62% in Mar 2025

YoY Growth in year ended Mar 2026 is 22.39% vs 20.75% in Mar 2025
About Virtuoso Optoelectronics Ltd

Company Coordinates


