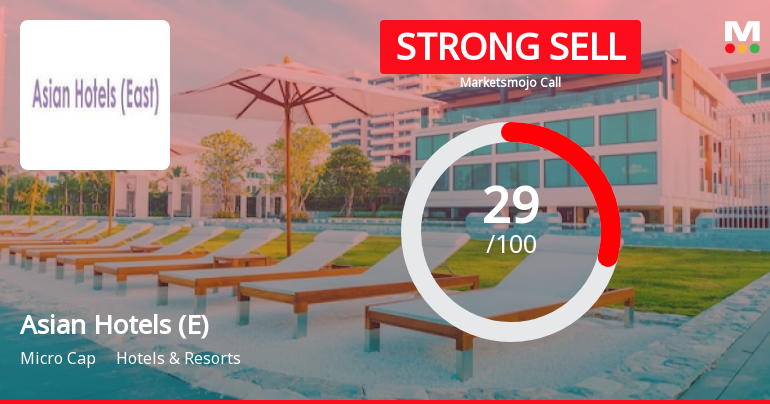
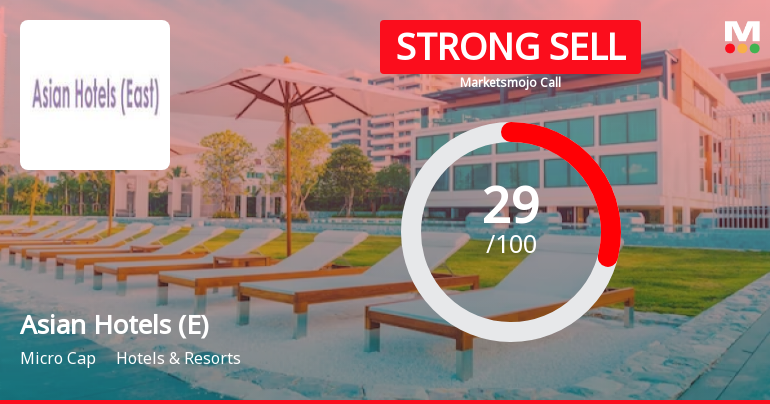
Asian Hotels (E)

  • Market Cap: Micro Cap
  • Industry: Hotels & Resorts
  • ISIN: INE926K01017
  • NSEID: AHLEAST
  • BSEID: 533227
INR
140.75
2.85 (2.07%)
BSENSE

Sep 01, 03:30 PM

BSE+NSE Vol: 5.07 k

  • Price Points
  • Score
  • Mojo Parameters
  • Total Return
  • News and Corporate Actions
  • Key factors
  • Shareholding
  • Financials
  • CompanyCV
stock-summaryPrice Point
High/Low

1Day

52 Week

Valuation
Technical
Day's Volume

CASH

5.07 k (57.75%) Volume

Shareholding (Jun 2026)

FII

0.00%

Held by 3 FIIs

DII

0.22%

Held by 3 DIIs

Promoter

65.63%

Why is Asian Hotels (East) Ltd falling/rising?

02-Sep-2026

As of 01-Sep, Asian Hotels (East) Ltd's stock price is rising to 140.75, driven by positive short-term performance and market sentiment, despite long-term challenges such as a high Debt to EBITDA ratio and underperformance over the past year. The stock's recent increase reflects strong buying interest and improved financial metrics, including a significant growth in Profit Before Tax.

As of 01-Sep, Asian Hotels (East) Ltd's stock price is rising, currently at 140.75, reflecting a change of 2.85 (2.07%) upward. This increase can be attributed to several factors. Notably, the stock outperformed its sector by 1.79% today, indicating positive market sentiment. Additionally, the stock reached an intraday high of Rs 143, which is a 3.7% increase, suggesting strong buying interest at that moment.<BR><BR>The company has reported positive financial metrics, including a significant growth in Profit Before Tax (PBT) of 69.8% compared to the previous four-quarter average, and a higher Profit After Tax (PAT) of Rs 21.32 Cr for the nine months. Furthermore, the inventory turnover ratio is at a high of 110.17 times, reflecting efficient management of inventory.<BR><BR>Despite these positive indicators, the stock has faced challenges in the longer term, with a return of -8.78% over the past year and underperformance compared to broader indices like the BSE500. However, the current rise in stock price seems to be driven by short-term positive performance and investor sentiment rather than long-term fundamentals, which remain weak due to a high Debt to EBITDA ratio and average Return on Capital Employed (ROCE) of 5.67%. Overall, the recent uptick in price appears to be a reaction to favorable short-term results and market conditions.

View full answer

Who are in the management team of Asian Hotels (E)?

01-Sep-2026

The management team of Asian Hotels (E) includes Arun Kumar Saraf and Umesh Saraf as Executive Directors, along with A C Chakrabortti, Padam Kumar Khaitan, Rita Bhimani, and Sandipan Chakravortty as Independent Non-Executive Directors.

The management team of Asian Hotels (E) includes the following individuals:<BR><BR>1. Arun Kumar Saraf - Executive Director, Joint Managing Director, and Promoter<BR>2. Umesh Saraf - Executive Director, Joint Managing Director, and Promoter<BR>3. A C Chakrabortti - Independent Non-Executive Director<BR>4. Padam Kumar Khaitan - Independent Non-Executive Director<BR>5. Rita Bhimani - Independent Non-Executive Woman Director<BR>6. Sandipan Chakravortty - Independent Non-Executive Director<BR><BR>If you have any more questions about the company or its operations, feel free to ask!

View full answer

What does Asian Hotels (E) do?

01-Sep-2026

Asian Hotels (East) Ltd operates in the Hotels & Resorts industry, focusing on hospitality services. As of June 2026, it reported net sales of 27 Cr and a net profit of 4 Cr, with a market cap of INR 246 Cr.

Overview:<BR>Asian Hotels (East) Ltd operates in the Hotels & Resorts industry and is categorized as a Micro Cap company.<BR><BR>History:<BR>The company was originally incorporated in 2007 as Vardhman Hotels Private Limited, converted to a public limited company later that year, and subsequently rebranded to Asian Hotels (East) Limited in 2010. The latest quarterly results reported net sales and profit for June 2026.<BR><BR>Financial Snapshot:<BR>- Net Sales: 27 Cr (Quarterly Results - Jun 2026)<BR>- Net Profit: 4 Cr (Quarterly Results - Jun 2026)<BR>- Market Cap: INR 246 Cr (Micro Cap)<BR><BR>Key Metrics:<BR>- P/E: 17.00<BR>- Industry P/E: 36<BR>- Dividend Yield: 0.71%<BR>- Debt Equity: 2.29<BR>- Return on Equity: 1.90%<BR>- Price to Book: 1.32<BR><BR>Contact Details:<BR>Address: Hyatt Regency Kolkata, JA-1 Sector III Salt Lake City Kolkata West Bengal : 700098 <BR>Tel: 91-33-68201346/1344 <BR>Email: saumen.chatterjee@asianhotelseast.c <BR>Website: http://www.ahleast.com

View full answer

Who are the peers of the Asian Hotels (E)?

01-Sep-2026

Asian Hotels (E) peers include Robust Hotels, Sayaji Hot. Pune, Espire Hospi, and others. It has average management risk and a 1-year return of -9.19%, better than Espire Hospi but worse than Savera Industrie, which leads with a 3.35% return.

Peers: The peers of Asian Hotels (E) are Robust Hotels, Sayaji Hot. Pune, Espire Hospi, Graviss Hospital, Country Club Hos, Savera Industrie, HBG Hotels, and Grand Continent.<BR><BR>Quality Snapshot: Excellent management risk is observed at Sayaji Hot. Pune and Savera Industrie, while Average management risk is found at Asian Hotels (E) and Grand Continent. Below Average management risk is seen at Robust Hotels, Espire Hospi, Graviss Hospital, Country Club Hos, HBG Hotels, and the rest. Growth is Excellent at Espire Hospi, Good at Robust Hotels and Savera Industrie, Average at Asian Hotels (E) and Grand Continent, and Below Average at Sayaji Hot. Pune, Graviss Hospital, and the rest. Capital Structure is Excellent at Sayaji Hot. Pune and Savera Industrie, Good at Graviss Hospital, and Below Average at Robust Hotels, Asian Hotels (E), Espire Hospi, Country Club Hos, HBG Hotels, and the rest.<BR><BR>Return Snapshot: The peer with the highest 1-year return is Savera Industrie at 3.35%, while the peer with the lowest is Espire Hospi at -71.69%. Asian Hotels (E) has a 1-year return of -9.19%, which is better than Espire Hospi but worse than Savera Industrie. Additionally, the six-month return is negative for Espire Hospi, HBG Hotels, and Country Club Hos.

View full answer

How big is Asian Hotels (E)?

01-Sep-2026

As of 31st August, Asian Hotels (East) Ltd has a market capitalization of 246.00 Cr and reported net sales of 124.20 Cr with a net loss of 47.79 Cr over the latest four quarters.

As of 31st August, <BR><BR>Market Cap: Asian Hotels (East) Ltd has a market capitalization of 246.00 Cr, classified as a Micro Cap.<BR><BR>Recent Quarterly Performance: The sum of Net Sales for the latest 4 quarters is 124.20 Cr, while the sum of Net Profit for the same period reflects a loss of 47.79 Cr.<BR><BR>Balance Sheet Snapshot: The reporting period is March 2026, with Shareholder's Funds amounting to 183.24 Cr and Total Assets valued at 702.22 Cr.

View full answer

Should I buy, sell or hold Asian Hotels (East) Ltd?

15-Aug-2026

When is the next results date for Asian Hotels (East) Ltd?

11-Aug-2026

The next results date for Asian Hotels (East) Ltd is 13 August 2026.

The next results date for Asian Hotels (East) Ltd is scheduled for 13 August 2026.

View full answer

Are Asian Hotels (East) Ltd latest results good or bad?

13-Feb-2026

Asian Hotels (East) Ltd's latest results are concerning, showing a net loss of ₹6.98 crores in Q2 FY26 compared to a profit last year, despite a 13.15% revenue growth. The high interest expenses and consecutive losses indicate significant challenges for the company.

The latest results for Asian Hotels (East) Ltd indicate a challenging situation for the company. In Q2 FY26, the company reported a net loss of ₹6.98 crores, which is a significant decline compared to a profit of ₹3.02 crores in the same quarter last year. This marks the second consecutive quarter of losses, raising concerns about its profitability.<BR><BR>On a positive note, the company achieved a revenue growth of 13.15% year-on-year, with net sales reaching ₹26.07 crores. Additionally, the operating margin (excluding other income) improved to 23.25%, reflecting better cost management. However, these operational improvements were overshadowed by a substantial interest expense of ₹10.37 crores, which consumed nearly 40% of the revenues, highlighting the company's struggle to cover its debt servicing obligations.<BR><BR>Overall, while there are some signs of operational resilience, the persistent losses and high debt burden indicate that the results are more negative than positive, suggesting significant challenges ahead for Asian Hotels (East) Ltd.

View full answer

How has been the historical performance of Asian Hotels (E)?

04-Dec-2025

Asian Hotels (E) showed improved net sales and operating profit in March 2025, with net sales rising to 113.02 Cr and operating profit increasing to 70.54 Cr. However, profit before tax and profit after tax declined, and cash flow from operating activities remained at zero, indicating ongoing profitability and cash flow challenges.

Answer:<BR>The historical performance of Asian Hotels (E) shows a fluctuating trend in key financial metrics over the years.<BR><BR>Breakdown:<BR>Asian Hotels (E) reported net sales of 113.02 Cr in March 2025, an increase from 108.47 Cr in March 2024 and significantly higher than 93.76 Cr in March 2023. The total operating income followed a similar trend, reaching 113.02 Cr in March 2025, up from 108.47 Cr in the previous year. The company experienced total expenditure of 83.52 Cr in March 2025, which was higher than 78.22 Cr in March 2024 but lower than 72.91 Cr in March 2023. Operating profit (PBDIT) for March 2025 was 70.54 Cr, a notable increase from 58.49 Cr in March 2024 and 22.89 Cr in March 2023. However, profit before tax decreased to 27.18 Cr in March 2025 from 42.54 Cr in March 2024. The profit after tax for March 2025 was 17.52 Cr, down from 31.71 Cr in March 2024, while earnings per share (EPS) decreased to 10.13 from 18.34. The total liabilities rose to 668.95 Cr in March 2025, compared to 604.57 Cr in March 2024. The total assets also increased to 668.95 Cr in March 2025 from 604.57 Cr in March 2024. Cash flow from operating activities was zero in March 2025, contrasting with a negative cash flow of -385 Cr in March 2024. Overall, the financial performance indicates a recovery in sales and operating profit, but challenges remain in profitability and cash flow management.

View full answer

Who are the top shareholders of the Asian Hotels (E)?

17-Jul-2025

The top shareholders of Asian Hotels (E) are Saraf Industries Limited with 41.9%, Sachdeva Stocks Private Limited at 7.67%, and individual investors who own 16.36%. Other shareholders include six mutual funds and four foreign institutional investors, but they hold a negligible percentage.

The top shareholders of Asian Hotels (E) include Saraf Industries Limited, which holds the largest stake at 41.9%. Other significant shareholders include Sachdeva Stocks Private Limited, with a 7.67% holding. Additionally, individual investors collectively own 16.36% of the company. There are also six mutual funds and four foreign institutional investors (FIIs), but they hold a negligible percentage of the shares.

View full answer

Is Asian Hotels (E) overvalued or undervalued?

09-Jun-2025

As of February 12, 2024, Asian Hotels (E) is considered very attractive and undervalued with a PE ratio of 13.83, significantly lower than its peers, indicating potential for recovery despite recent underperformance compared to the Sensex.

As of 12 February 2024, the valuation grade for Asian Hotels (E) has moved from attractive to very attractive, indicating a positive shift in its perceived value. The company is currently assessed as undervalued. Key ratios include a PE Ratio of 13.83, an EV to EBITDA of 19.10, and a Price to Book Value of 1.00, which suggest that the company is trading at a reasonable valuation compared to its earnings and asset base.<BR><BR>In comparison to its peers, Asian Hotels (E) stands out with a significantly lower PE ratio than Indian Hotels Co, which has a PE of 66.81, and ITC Hotels, which has a PE of 65.26, both categorized as very expensive. The PEG ratio for Asian Hotels is 0.00, further reinforcing its undervaluation relative to the industry. Additionally, while the stock has underperformed the Sensex on a year-to-date basis with a return of -18.55% compared to the Sensex's 5.58%, its long-term performance over five years shows a gain of 67.97%, which is still below the Sensex's 142.95%. This disparity highlights the potential for recovery and growth in the company's valuation.

View full answer

What is the technical trend for Asian Hotels (E)?

09-Jun-2025

As of April 16, 2025, Asian Hotels (E) exhibits a mildly bearish technical trend, with mixed signals from key indicators like the MACD and moving averages suggesting short-term weakness.

As of 16 April 2025, the technical trend for Asian Hotels (E) has changed from bearish to mildly bearish. The weekly MACD indicates a mildly bullish stance, while the monthly MACD shows a mildly bearish trend. The daily moving averages are mildly bearish, suggesting short-term weakness. The Bollinger Bands are mildly bullish on the weekly chart but sideways on the monthly, indicating mixed signals. The KST is mildly bullish weekly and mildly bearish monthly, and the Dow Theory shows no trend on the weekly but mildly bullish on the monthly. Overall, the current technical stance is mildly bearish, with key indicators such as the daily moving averages and monthly MACD contributing to this view.

View full answer

What is the bonus history of the Asian Hotels (E)?

06-Jun-2025

Asian Hotels (East) Ltd announced a 1:2 bonus issue on October 6, 2022, meaning shareholders received one additional share for every two shares held as of the record date, October 7, 2022.

Asian Hotels (East) Ltd has a recent bonus history where they announced a 1:2 bonus issue. The ex-date for this bonus was October 6, 2022, and the record date was October 7, 2022. This means that shareholders received one additional share for every two shares they held as of the record date. If you have any more questions about the company or its financial activities, feel free to ask!

View full answer

Has Asian Hotels (E) declared dividend?

06-Jun-2025

Yes, Asian Hotels (East) Ltd has declared a 25% dividend, amounting to ₹2.5 per share, with an ex-date of September 6, 2024. While recent performance shows mixed total returns, the company has maintained a consistent dividend policy.

Asian Hotels (East) Ltd has declared a 25% dividend.<BR><BR>Dividend Details:<BR>- Percentage announced: 25%<BR>- Amount per share: 2.5<BR>- Ex-date: 06 Sep 2024<BR><BR>Dividend Yield: 1.8%.<BR><BR>Total Returns by Period:<BR>In the last 6 months, the price return was -19.3%, the dividend return was 0%, resulting in a total return of -19.3%.<BR><BR>Over the past year, the price return was -0.64%, with a dividend return of 1.73%, leading to a total return of 1.09%.<BR><BR>In the last 2 years, the price return was 11.96%, the dividend return was 4.07%, culminating in a total return of 16.03%.<BR><BR>For the 3-year period, the price return was 7.23%, the dividend return was 4.06%, resulting in a total return of 11.29%.<BR><BR>Over the past 4 years, the price return was 25.28%, the dividend return was 5.00%, leading to a total return of 30.28%.<BR><BR>In the last 5 years, the price return was 61.37%, with a dividend return of 6.30%, resulting in a total return of 67.67%.<BR><BR>Overall, Asian Hotels (East) Ltd has declared a significant dividend while showing mixed total returns across different periods, with a notable increase in returns over the longer term. The recent performance indicates challenges in the short term, but the company has maintained a consistent dividend policy.

View full answer
iScoreScore
Click here to find our call on this stock
Strong Sell
Sell
Hold
Buy
Strong Buy

Dashboard

1

Weak Long Term Fundamental Strength with an average Return on Capital Employed (ROCE) of 5.67%

  • Low ability to service debt as the company has a high Debt to EBITDA ratio of 11.55 times
2

Below par performance in long term as well as near term

stock-summaryMojo Parameters

Mojo Parameters

Loading Valuation Snapshot...

Stock DNA

stock-summary
Industry

Hotels & Resorts

stock-summary
Market cap

INR 239 Cr (Micro Cap)

stock-summary
P/E

17.00

stock-summary
Industry P/E

36

stock-summary
Dividend Yield

0.00%

stock-summary
Debt Equity

2.29

stock-summary
Return on Equity

1.90%

stock-summary
Price to Book

1.30

Revenue and Profits:
Net Sales:
27 Cr
(Quarterly Results - Jun 2026)
Net Profit:
4 Cr
stock-summaryTotal Returns
Total Returns (Price + Dividend) stock-summary
Dividend Yield (0%)
TimePeriod
Price Return
Dividend Return
Total Return
3 Months
-12.71%
0%
-12.71%
6 Months
-9.89%
0%
-9.89%
1 Year
-8.78%
0%
-8.78%
2 Years
4.72%
0.75%
5.47%
3 Years
-11.09%
2.50%
-8.59%
4 Years
5.74%
2.99%
8.73%
5 Years
37.0%
5.52%
42.52%

Latest dividend: 1 per share ex-dividend date: Aug-29-2025

Risk Adjusted Returns v/s stock-summary
Returns Beta
Icon
Beta has not been calculated since enough price history is not available
stock-summaryNews & Corporate Actions

Announcements stock-summary

Disclosures under Reg. 29(2) of SEBI (SAST) Regulations 2011

31-Aug-2026 | Source : BSE

The Exchange has received the disclosure under Regulation 29(2) of SEBI (Substantial Acquisition of Shares & Takeovers) Regulations 2011 for Arun Kumar Saraf & PACs

Announcement under Regulation 30 (LODR)-Change in Management

27-Aug-2026 | Source : BSE

Please find attached the disclosure under Regulation 30 of the Listing Regulations 2015.

Shareholder Meeting / Postal Ballot-Scrutinizers Report

27-Aug-2026 | Source : BSE

Please find attached the voting results under Regulation 44 of the Listing Regulations 2015 and the Scrutinisers Report under Section 108 of the Companies Act 2013 in respect of the 19th AGM of the Company.

Corporate Actions stock-summary

stock-summary
BOARD MEETING

No Upcoming Board Meetings

stock-summary
DIVIDEND

Asian Hotels (East) Ltd has declared 10% dividend, ex-date: 29 Aug 25

stock-summary
SPLITS

No Splits history available

stock-summary
BONUS

Asian Hotels (East) Ltd has announced 1:2 bonus issue, ex-date: 06 Oct 22

stock-summary
RIGHTS

No Rights history available

stock-summaryKey Factors

Quality key factors stock-summary

Factor
Value
Sales Growth (5y)
15.01%
EBIT Growth (5y)
25.80%
EBIT to Interest (avg)
1.97
Debt to EBITDA (avg)
1.25
Net Debt to Equity (avg)
2.29
Sales to Capital Employed (avg)
0.24
Tax Ratio
23.94%
Dividend Payout Ratio
9.87%
Pledged Shares
0
Institutional Holding
0.23%
ROCE (avg)
3.83%
ROE (avg)
5.59%

Valuation key factors

Factor
Value
P/E Ratio
17
Industry P/E
36
Price to Book Value
1.33
EV to EBIT
20.09
EV to EBITDA
17.50
EV to Capital Employed
1.10
EV to Sales
5.33
PEG Ratio
0.65
Dividend Yield
NA
ROCE (Latest)
5.40%
ROE (Latest)
1.90%

Technicals key factors

Indicator
Weekly
Monthly
MACD
Bearish
Mildly Bearish
RSI
No Signal
No Signal
Bollinger Bands
Mildly Bearish
Mildly Bearish
Moving Averages
Bearish (Daily)
KST
Bearish
Mildly Bearish
Dow Theory
Mildly Bearish
No Trend
OBV
No Trend
No Trend
stock-summary Technical Indicator Scale: Bearish, Mildly Bearish, Sideways, Mildly Bullish, Bullish  Turned 
stock-summaryShareholding
Shareholding Snapshot : Jun 2026stock-summary
Shareholding Compare (%holding) stock-summary
Majority shareholders

Promoters

Pledged Promoter Holdings

None

Mutual Funds

Held by 6 Schemes (0.0%)

FIIs

Held by 3 FIIs (0.0%)

Promoter with highest holding

Saraf Industries Limited (41.9%)

Highest Public shareholder

Sachdeva Stocks Private Limited (8.72%)

Individual Investors Holdings

14.92%

stock-summaryFinancial
[
  {
    "link": "quarterly",
    "btn_text": "All Quarterly Results",
    "header": "Quarterly Results Snapshot (Consolidated) - Jun'26 - QoQ",
    "rhs": [
      {
        "prefix": "Net Sales ",
        "suffix": "QoQ Growth in quarter ended Jun 2026 is -21.73% vs -7.04% in Mar 2026",
        "dir": -1
      },
      {
        "prefix": "Consolidated Net Profit ",
        "suffix": "QoQ Growth in quarter ended Jun 2026 is -42.40% vs 114.25% in Mar 2026",
        "dir": -1
      }
    ],
    "table": {
      "header": [
        "Jun'26",
        "Mar'26",
        "Change(%)"
      ],
      "body": [
        {
          "field": "Net Sales",
          "val1": "26.87",
          "val2": "34.33",
          "chgp": "-21.73%",
          "chgp_class": "negative"
        },
        {
          "field": "Operating Profit (PBDIT) excl Other Income",
          "val1": "6.48",
          "val2": "11.40",
          "chgp": "-43.16%",
          "chgp_class": "negative"
        },
        {
          "field": "Interest",
          "val1": "0.03",
          "val2": "0.00",
          "chgp": "",
          "chgp_class": "neutral"
        },
        {
          "field": "Exceptional Items",
          "val1": "0.00",
          "val2": "0.00",
          "chgp": "",
          "chgp_class": "neutral"
        },
        {
          "field": "Consolidate Net Profit",
          "val1": "4.32",
          "val2": "7.50",
          "chgp": "-42.40%",
          "chgp_class": "negative"
        },
        {
          "field": "Operating Profit Margin (Excl OI)",
          "val1": "24.12%",
          "val2": "33.21%",
          "chgp": "-9.09%",
          "chgp_class": "negative"
        }
      ]
    }
  },
  {
    "link": "half-yearly",
    "btn_text": "All Half Yearly Results",
    "header": "Half Yearly Results Snapshot (Consolidated) - Sep'25",
    "rhs": [
      {
        "prefix": "Net Sales ",
        "suffix": " Growth in half year ended Sep 2025 is 12.15% vs 6.61% in Sep 2024",
        "dir": 1
      },
      {
        "prefix": "Consolidated Net Profit ",
        "suffix": " Growth in half year ended Sep 2025 is -613.31% vs -75.37% in Sep 2024",
        "dir": -1
      }
    ],
    "table": {
      "header": [
        "Sep'25",
        "Sep'24",
        "Change(%)"
      ],
      "body": [
        {
          "field": "Net Sales",
          "val1": "51.03",
          "val2": "45.50",
          "chgp": "12.15%",
          "chgp_class": "positive"
        },
        {
          "field": "Operating Profit (PBDIT) excl Other Income",
          "val1": "11.84",
          "val2": "4.52",
          "chgp": "161.95%",
          "chgp_class": "positive"
        },
        {
          "field": "Interest",
          "val1": "20.24",
          "val2": "17.90",
          "chgp": "13.07%",
          "chgp_class": "negative"
        },
        {
          "field": "Exceptional Items",
          "val1": "0.00",
          "val2": "0.00",
          "chgp": "",
          "chgp_class": "neutral"
        },
        {
          "field": "Consolidate Net Profit",
          "val1": "-13.50",
          "val2": "2.63",
          "chgp": "-613.31%",
          "chgp_class": "negative"
        },
        {
          "field": "Operating Profit Margin (Excl OI)",
          "val1": "23.20%",
          "val2": "9.93%",
          "chgp": "13.27%",
          "chgp_class": "positive"
        }
      ]
    }
  },
  {
    "link": "nine-monthly",
    "btn_text": "All Nine Monthly Results",
    "header": "Nine Monthly Results Snapshot (Consolidated) - Dec'25",
    "rhs": [
      {
        "prefix": "Net Sales ",
        "suffix": "YoY Growth in nine months ended Dec 2025 is 12.70% vs 4.26% in Dec 2024",
        "dir": 1
      },
      {
        "prefix": "Consolidated Net Profit ",
        "suffix": "YoY Growth in nine months ended Dec 2025 is -986.46% vs -39.98% in Dec 2024",
        "dir": -1
      }
    ],
    "table": {
      "header": [
        "Dec'25",
        "Dec'24",
        "Change(%)"
      ],
      "body": [
        {
          "field": "Net Sales",
          "val1": "87.96",
          "val2": "78.05",
          "chgp": "12.70%",
          "chgp_class": "positive"
        },
        {
          "field": "Operating Profit (PBDIT) excl Other Income",
          "val1": "25.75",
          "val2": "15.33",
          "chgp": "67.97%",
          "chgp_class": "positive"
        },
        {
          "field": "Interest",
          "val1": "20.31",
          "val2": "30.35",
          "chgp": "-33.08%",
          "chgp_class": "positive"
        },
        {
          "field": "Exceptional Items",
          "val1": "-62.13",
          "val2": "0.00",
          "chgp": "",
          "chgp_class": "neutral"
        },
        {
          "field": "Consolidate Net Profit",
          "val1": "-66.13",
          "val2": "7.46",
          "chgp": "-986.46%",
          "chgp_class": "negative"
        },
        {
          "field": "Operating Profit Margin (Excl OI)",
          "val1": "29.27%",
          "val2": "19.64%",
          "chgp": "9.63%",
          "chgp_class": "positive"
        }
      ]
    }
  },
  {
    "link": "annual",
    "btn_text": "All Annual Results",
    "header": "Annual Results Snapshot (Consolidated) - Mar'26",
    "rhs": [
      {
        "prefix": "Net Sales ",
        "suffix": "YoY Growth in year ended Mar 2026 is 8.20% vs 4.19% in Mar 2025",
        "dir": 1
      },
      {
        "prefix": "Consolidated Net Profit ",
        "suffix": "YoY Growth in year ended Mar 2026 is -434.70% vs -44.75% in Mar 2025",
        "dir": -1
      }
    ],
    "table": {
      "header": [
        "Mar'26",
        "Mar'25",
        "Change(%)"
      ],
      "body": [
        {
          "field": "Net Sales",
          "val1": "122.29",
          "val2": "113.02",
          "chgp": "8.20%",
          "chgp_class": "positive"
        },
        {
          "field": "Operating Profit (PBDIT) excl Other Income",
          "val1": "37.13",
          "val2": "29.50",
          "chgp": "25.86%",
          "chgp_class": "positive"
        },
        {
          "field": "Interest",
          "val1": "20.31",
          "val2": "39.53",
          "chgp": "-48.62%",
          "chgp_class": "positive"
        },
        {
          "field": "Exceptional Items",
          "val1": "-62.13",
          "val2": "0.00",
          "chgp": "",
          "chgp_class": "neutral"
        },
        {
          "field": "Consolidate Net Profit",
          "val1": "-58.64",
          "val2": "17.52",
          "chgp": "-434.70%",
          "chgp_class": "negative"
        },
        {
          "field": "Operating Profit Margin (Excl OI)",
          "val1": "30.36%",
          "val2": "26.10%",
          "chgp": "4.26%",
          "chgp_class": "positive"
        }
      ]
    }
  }
]

Quarterly Results Snapshot (Consolidated) - Jun'26 - QoQstock-summary

Jun'26
Mar'26
Change(%)
Net Sales
26.87
34.33
-21.73%
Operating Profit (PBDIT) excl Other Income
6.48
11.40
-43.16%
Interest
0.03
0.00
Exceptional Items
0.00
0.00
Consolidate Net Profit
4.32
7.50
-42.40%
Operating Profit Margin (Excl OI)
24.12%
33.21%
-9.09%
Values in Rs Cr.
Direction Arrows
Net Sales

QoQ Growth in quarter ended Jun 2026 is -21.73% vs -7.04% in Mar 2026

Direction Arrows
Consolidated Net Profit

QoQ Growth in quarter ended Jun 2026 is -42.40% vs 114.25% in Mar 2026

Half Yearly Results Snapshot (Consolidated) - Sep'25stock-summary

Sep'25
Sep'24
Change(%)
Net Sales
51.03
45.50
12.15%
Operating Profit (PBDIT) excl Other Income
11.84
4.52
161.95%
Interest
20.24
17.90
13.07%
Exceptional Items
0.00
0.00
Consolidate Net Profit
-13.50
2.63
-613.31%
Operating Profit Margin (Excl OI)
23.20%
9.93%
13.27%
Values in Rs Cr.
Direction Arrows
Net Sales

Growth in half year ended Sep 2025 is 12.15% vs 6.61% in Sep 2024

Direction Arrows
Consolidated Net Profit

Growth in half year ended Sep 2025 is -613.31% vs -75.37% in Sep 2024

Nine Monthly Results Snapshot (Consolidated) - Dec'25stock-summary

Dec'25
Dec'24
Change(%)
Net Sales
87.96
78.05
12.70%
Operating Profit (PBDIT) excl Other Income
25.75
15.33
67.97%
Interest
20.31
30.35
-33.08%
Exceptional Items
-62.13
0.00
Consolidate Net Profit
-66.13
7.46
-986.46%
Operating Profit Margin (Excl OI)
29.27%
19.64%
9.63%
Values in Rs Cr.
Direction Arrows
Net Sales

YoY Growth in nine months ended Dec 2025 is 12.70% vs 4.26% in Dec 2024

Direction Arrows
Consolidated Net Profit

YoY Growth in nine months ended Dec 2025 is -986.46% vs -39.98% in Dec 2024

Annual Results Snapshot (Consolidated) - Mar'26stock-summary

Mar'26
Mar'25
Change(%)
Net Sales
122.29
113.02
8.20%
Operating Profit (PBDIT) excl Other Income
37.13
29.50
25.86%
Interest
20.31
39.53
-48.62%
Exceptional Items
-62.13
0.00
Consolidate Net Profit
-58.64
17.52
-434.70%
Operating Profit Margin (Excl OI)
30.36%
26.10%
4.26%
Values in Rs Cr.
Direction Arrows
Net Sales

YoY Growth in year ended Mar 2026 is 8.20% vs 4.19% in Mar 2025

Direction Arrows
Consolidated Net Profit

YoY Growth in year ended Mar 2026 is -434.70% vs -44.75% in Mar 2025

stock-summaryCompany CV
About Asian Hotels (East) Ltd stock-summary
stock-summary
Asian Hotels (East) Ltd
Micro Cap
Hotels & Resorts
Asian Hotels (East) Limited was originally incorporated on January 8, 2007 as a private limited company with the name Vardhman Hotels Private Limited. On July 28, 2007, the company was converted into public limited company and the name was changed to Vardhman Hotels Limited. Further, the name of the company was changed from Vardhman Hotels Limited to Asian Hotels (East) Limited with effect from February 16, 2010.
Company Coordinates stock-summary
Company Details
Hyatt Regency Kolkata, JA-1 Sector III Salt Lake City Kolkata West Bengal : 700098
stock-summary
Tel: 91-33-68201346/1344
stock-summary
saumen.chatterjee@asianhotelseast.c
Registrar Details
Karvy Computershare Pvt Ltd, Plot No 17-24 , Near Image Hospital,, Reliance Cybervilae,Vithalrao Nagar,, Madhapur, Hyderabad