
Compare Asian Tea & Exp with Similar Stocks
Dashboard
Weak Long Term Fundamental Strength with a -33.33% CAGR growth in Operating Profits over the last 5 years
- Company's ability to service its debt is weak with a poor EBIT to Interest (avg) ratio of 0.15
- The company has been able to generate a Return on Equity (avg) of 1.77% signifying low profitability per unit of shareholders funds
Consistent Underperformance against the benchmark over the last 3 years
Stock DNA
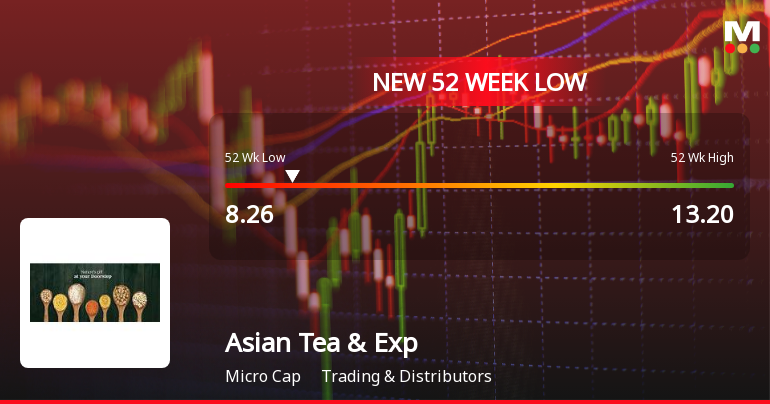
Trading & Distributors
INR 22 Cr (Micro Cap)
40.00
59
0.00%
0.19
0.81%
0.32
Total Returns (Price + Dividend) 
Asian Tea & Exp for the last several years.
Risk Adjusted Returns v/s
Returns Beta

News
Are Asian Tea & Exports Ltd latest results good or bad?
Asian Tea & Exports Ltd's latest financial results for Q4 FY26 reveal a complex situation characterized by significant revenue growth alongside persistent profitability challenges. The company reported its highest quarterly revenue of ₹25.04 crores, reflecting a 50.48% increase compared to the previous quarter. However, this revenue growth did not translate into profitability, as the company faced a net loss of ₹0.36 crores for the quarter, marking a substantial deterioration from the previous quarter's loss. The operating margin for Q4 FY26 was recorded at a mere 0.32%, a notable decline from the 1.98% achieved in the prior quarter. This compression in margins highlights ongoing operational difficulties, exacerbated by negative other income and high interest expenses. The net profit margin also fell into negative territory at -1.44%, a stark contrast to the positive margins observed in earlier periods. I...
Read full news article
Asian Tea & Exports Q4 FY26: Quarterly Loss Deepens Despite Revenue Surge
Asian Tea & Exports Ltd., a Kolkata-based trading and distribution company with a ₹25.00 crore market capitalisation, reported a consolidated net loss of ₹0.36 crores for Q4 FY26, marking a substantial deterioration from the ₹0.06 crore loss in the previous quarter. The company's stock traded at ₹9.98 on June 01, 2026, reflecting a modest 0.40% gain for the day but remaining under pressure with a 15.99% decline over the past year.
Read full news article Announcements
Compliances-Certificate under Reg. 74 (5) of SEBI (DP) Regulations 2018
09-Jul-2026 | Source : BSEWe enclose herewith the letter confirming the dematerialization of equity shares of the Company from S.K. INFOSOLUTIONS PVT. LTD. (RTA) for the first quarter ended 30th June 2026 under Regulation 74(5) of SEBI (Depositories and Participants) Regulations 2018. Further we hereby certify that the securities which were dematerialized are listed on the Stock Exchange(s) where the earlier issued securities are listed. We request you to take this information on record.
Closure of Trading Window
25-Jun-2026 | Source : BSEThis is to inform that pursuant to the Companys Code of Conduct for Prevention of Insider Trading adopted by the Company under the SEBI (Prohibition of Insider Trading) Regulations 2015 the trading window for dealing in the securities of the Company will be closed for the Designated Persons and their immediate relatives from Wednesday 01st July 2026 to till 48 hours after the declaration of the Unaudited Financial Results to the Stock Exchange for the 1st quarter ended 30th June 2026. The date of Board Meeting for consideration and approval of the aforesaid Financial Results shall be intimated in due course. Accordingly the Designated Persons have been intimated not to trade in the securities of the Company during the above said period of closure of trading window. You are requested to take the same on your record
Announcement under Regulation 30 (LODR)-Newspaper Publication
01-Jun-2026 | Source : BSENewspaper Publication of Audited Financial Results (Standalone & Consolidated) for the 4th quarter and year ended 31st March 2026 in Financial Express in English Language and Arthik Lipi in Bengali Language dated 01st June 2026.
Corporate Actions

No Upcoming Board Meetings

No Dividend history available

No Splits history available

No Bonus history available

Asian Tea & Exports Ltd has announced 1:1 rights issue, ex-date: 08 Nov 21
Quality key factors
Valuation key factors
Technicals key factors
 Technical Indicator Scale: Bearish, Mildly Bearish, Sideways, Mildly Bullish, Bullish Turned
 Shareholding Snapshot : Jun 2026
Shareholding Compare (%holding)
Promoters
None
Held by 2 Schemes (0.06%)
Held by 0 FIIs
Asian Capital Market Limited (14.0%)
Jugal Kishore Bhagat (4.68%)
38.14%
Quarterly Results Snapshot (Consolidated) - Mar'26 - QoQ

QoQ Growth in quarter ended Mar 2026 is 50.48% vs 26.73% in Dec 2025

QoQ Growth in quarter ended Mar 2026 is -500.00% vs -108.45% in Dec 2025
Half Yearly Results Snapshot (Consolidated) - Sep'25
Growth in half year ended Sep 2025 is 6.30% vs 78.82% in Sep 2024
Growth in half year ended Sep 2025 is -6.60% vs 55.88% in Sep 2024
Nine Monthly Results Snapshot (Consolidated) - Dec'25
YoY Growth in nine months ended Dec 2025 is 50.97% vs 23.45% in Dec 2024
YoY Growth in nine months ended Dec 2025 is -43.64% vs 41.03% in Dec 2024
Annual Results Snapshot (Consolidated) - Mar'26
YoY Growth in year ended Mar 2026 is 27.96% vs 27.87% in Mar 2025
YoY Growth in year ended Mar 2026 is 14.00% vs 400.00% in Mar 2025
About Asian Tea & Exports Ltd

Company Coordinates


