
Compare Assoc.Alcohols with Similar Stocks
Total Returns (Price + Dividend) 
Latest dividend: 2 per share ex-dividend date: Jul-25-2025
Risk Adjusted Returns v/s
Returns Beta

News
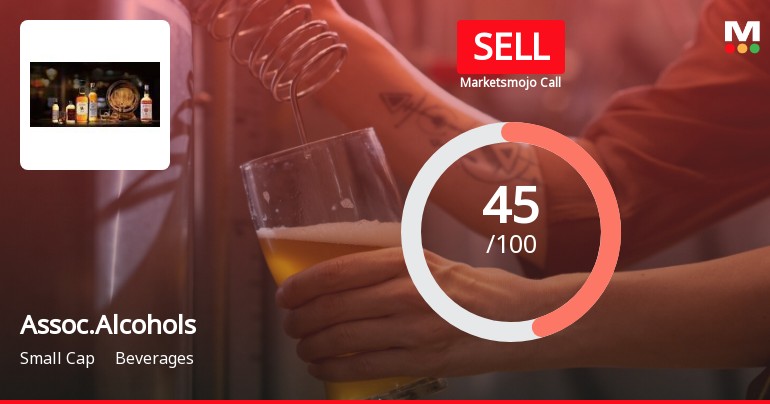
Associated Alcohols & Breweries Ltd is Rated Sell
Associated Alcohols & Breweries Ltd is rated Sell by MarketsMOJO. This rating was last updated on 08 Nov 2025, reflecting a reassessment of the stock’s outlook. However, all fundamentals, returns, and financial metrics discussed below are current as of 03 June 2026, providing investors with the latest perspective on the company’s performance and prospects.
Read full news article
Associated Alcohols & Breweries Ltd Sees Mixed Technical Signals Amid Price Momentum Shift
Associated Alcohols & Breweries Ltd has experienced a nuanced shift in its technical momentum, reflecting a complex interplay of bullish and bearish indicators across multiple timeframes. Despite a recent uptick in price, the stock remains under pressure with a downgraded rating and mixed signals from key technical tools such as MACD, RSI, and moving averages.
Read full news article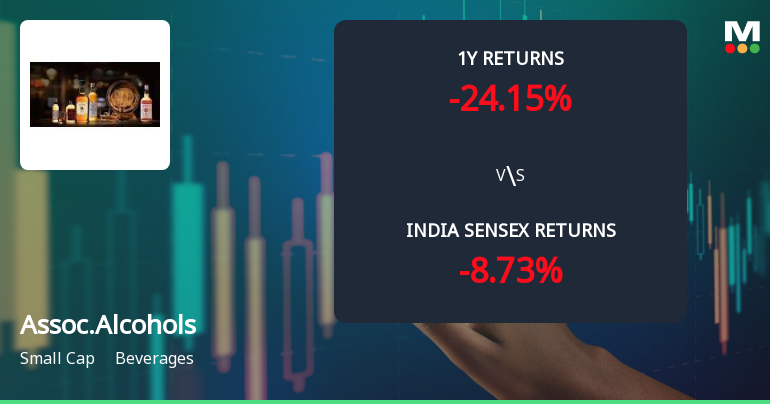
Associated Alcohols & Breweries Ltd Faces Bearish Momentum Amid Technical Downgrade
Associated Alcohols & Breweries Ltd has experienced a notable shift in its technical momentum, with key indicators signalling a transition from mildly bearish to a more pronounced bearish trend. The stock’s recent price action, combined with deteriorating technical signals, suggests mounting pressure on the beverage sector player amid broader market challenges.
Read full news article Announcements
Receipt Of Best Employer Brand Award 2026
11-Jun-2026 | Source : BSEReceipt of Best Employer Brand Award 2026
Announcement under Regulation 30 (LODR)-Analyst / Investor Meet - Intimation
09-Jun-2026 | Source : BSEAnalyst/ Investor Meet
Announcement under Regulation 30 (LODR)-Newspaper Publication
02-Jun-2026 | Source : BSESubmission of Newspaper clipping of advertisement regarding opening of another special window for transfer and depalatalization of physical securities pursuant to SEBI Circular
Corporate Actions

No Upcoming Board Meetings

Associated Alcohols & Breweries Ltd has declared 20% dividend, ex-date: 25 Jul 25

No Splits history available

Associated Alcohols & Breweries Ltd has announced 1:1 bonus issue, ex-date: 10 Mar 16

No Rights history available
Quality key factors
Valuation key factors
Technicals key factors
 Technical Indicator Scale: Bearish, Mildly Bearish, Sideways, Mildly Bullish, Bullish Turned
 Shareholding Snapshot : Mar 2026
Shareholding Compare (%holding)
Promoters
None
Held by 0 Schemes
Held by 22 FIIs (0.33%)
Anshuman Kedia (9.79%)
Nishid Babulal Shah (1.2%)
27.41%
Quarterly Results Snapshot (Standalone) - Mar'26 - QoQ

QoQ Growth in quarter ended Mar 2026 is -8.40% vs 2.58% in Dec 2025
QoQ Growth in quarter ended Mar 2026 is -13.88% vs 94.86% in Dec 2025
Half Yearly Results Snapshot (Consolidated) - Sep'25
Not Applicable: The company has declared_date for only one period
Not Applicable: The company has declared_date for only one period
Nine Monthly Results Snapshot (Consolidated) - Dec'25
Not Applicable: The company has declared_date for only one period
Not Applicable: The company has declared_date for only one period
Annual Results Snapshot (Consolidated) - Mar'26
Not Applicable: The company has declared_date for only one period
Not Applicable: The company has declared_date for only one period
About Associated Alcohols & Breweries Ltd

Company Coordinates


