
Compare Astec Lifescienc with Similar Stocks
Dashboard
Weak Long Term Fundamental Strength with a -189.54% CAGR growth in Operating Profits over the last 5 years
- Low ability to service debt as the company has a high Debt to EBITDA ratio of -99.10 times
- The company has been able to generate a Return on Equity (avg) of 5.75% signifying low profitability per unit of shareholders funds
Risky - Negative EBITDA
Consistent Underperformance against the benchmark over the last 3 years
Stock DNA
Pesticides & Agrochemicals
INR 1,527 Cr (Small Cap)
NA (Loss Making)
28
0.00%
1.12
-20.18%
3.94
Total Returns (Price + Dividend) 
Latest dividend: 1.4969262295081964 per share ex-dividend date: Jul-21-2023
Risk Adjusted Returns v/s
Returns Beta

News

Astec Lifesciences Ltd is Rated Sell
Astec Lifesciences Ltd is rated 'Sell' by MarketsMOJO, with this rating last updated on 08 June 2026. However, the analysis and financial metrics discussed here reflect the stock's current position as of 01 July 2026, providing investors with an up-to-date view of its fundamentals, valuation, financial trends, and technical outlook.
Read full news article
Astec Lifesciences Ltd Technical Momentum Shifts Amid Mixed Market Signals
Astec Lifesciences Ltd, a small-cap player in the Pesticides & Agrochemicals sector, has experienced a notable shift in its technical momentum, reflecting a complex interplay of bullish and bearish signals. Despite a recent downgrade in its Mojo Grade from Strong Sell to Sell, the stock’s technical indicators reveal a nuanced picture that investors must carefully analyse amid broader market trends.
Read full news article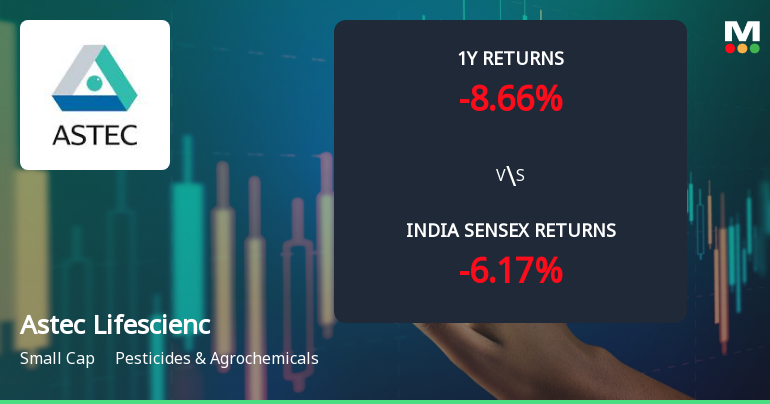
Astec Lifesciences Ltd Technical Momentum Shifts Amid Mixed Market Returns
Astec Lifesciences Ltd, a small-cap player in the Pesticides & Agrochemicals sector, has experienced a notable shift in its technical momentum, moving from a mildly bullish to a bullish trend. Despite a recent day decline of 2.10%, the stock’s technical indicators present a complex picture, with bullish signals from MACD and moving averages contrasting with bearish cues from Bollinger Bands and on-balance volume. This article analyses the evolving technical landscape and what it means for investors navigating this volatile stock.
Read full news article Announcements
Astec LifeSciences Limited - Other General Purpose
22-Nov-2019 | Source : NSEAstec LifeSciences Limited has informed the Exchange that Pursuant to Regulation 23(9) of the Securities and Exchange Board of India (Listing Obligations and Disclosure Requirements) Regulations, 2015, the Company has submitted a copy of disclosure on Related Party Transactions for the Half Year ended September 30, 2019 on a consolidated basis, drawn in accordance with the applicable Accounting Standards.
Shareholders meeting
27-Jul-2019 | Source : NSE
| Astec LifeSciences Limited has informed the Exchange regarding Proceedings of Annual General Meeting held on July 26, 2019. Further, the company has submitted the Exchange a copy of Srutinizers report along with voting results. |
Outcome of Board Meeting
26-Jul-2019 | Source : NSE
| Astec LifeSciences Limited has informed the Exchange regarding Outcome of Board Meeting held on July 26, 2019. |
Corporate Actions

No Upcoming Board Meetings

Astec Lifesciences Ltd has declared 15% dividend, ex-date: 21 Jul 23

No Splits history available

No Bonus history available

Astec Lifesciences Ltd has announced 1:7 rights issue, ex-date: 04 Jul 25
Quality key factors
Valuation key factors
Technicals key factors
 Technical Indicator Scale: Bearish, Mildly Bearish, Sideways, Mildly Bullish, Bullish Turned
 Shareholding Snapshot : Mar 2026
Shareholding Compare (%holding)
Promoters
None
Held by 3 Schemes (3.02%)
Held by 6 FIIs (0.02%)
Godrej Agrovet Limited (67.03%)
Nippon Life India Trustee Ltd-a/c Nippon India Small Cap Fund (2.36%)
20.81%
Quarterly Results Snapshot (Consolidated) - Mar'26 - YoY

YoY Growth in quarter ended Mar 2026 is 32.70% vs -22.26% in Mar 2025
YoY Growth in quarter ended Mar 2026 is 51.77% vs -1,558.76% in Mar 2025
Half Yearly Results Snapshot (Consolidated) - Sep'25
Growth in half year ended Sep 2025 is -1.86% vs -33.80% in Sep 2024
Growth in half year ended Sep 2025 is 26.60% vs -262.07% in Sep 2024
Nine Monthly Results Snapshot (Consolidated) - Dec'25
YoY Growth in nine months ended Dec 2025 is 10.60% vs -14.01% in Dec 2024
YoY Growth in nine months ended Dec 2025 is 38.34% vs -158.24% in Dec 2024
Annual Results Snapshot (Consolidated) - Mar'26
YoY Growth in year ended Mar 2026 is 17.53% vs -16.78% in Mar 2025
YoY Growth in year ended Mar 2026 is 39.95% vs -187.13% in Mar 2025
About Astec Lifesciences Ltd

Company Coordinates


